

You are sitting on a job offer and your hands are damp. The number on the page is fine, but your gut says the role is worth more. You just cannot prove it, so you are tempted to say yes to avoid the discomfort.
You are not alone. 60% of workers say they lack confidence negotiating (LinkedIn Workforce Confidence Index), and that hesitation is expensive. The anchoring effect works against you the moment you accept the first number without a counter.
This seven-step methodology replaces emotional guesswork with an evidence-backed ask. By the time you schedule the conversation, you will have a one-page brief that cites specific employer data, total rewards valuations, and geographic differentials.
Most job seekers open a browser, type a job title into Glassdoor, and stop there. That single-number search leaves thousands of dollars on the table.
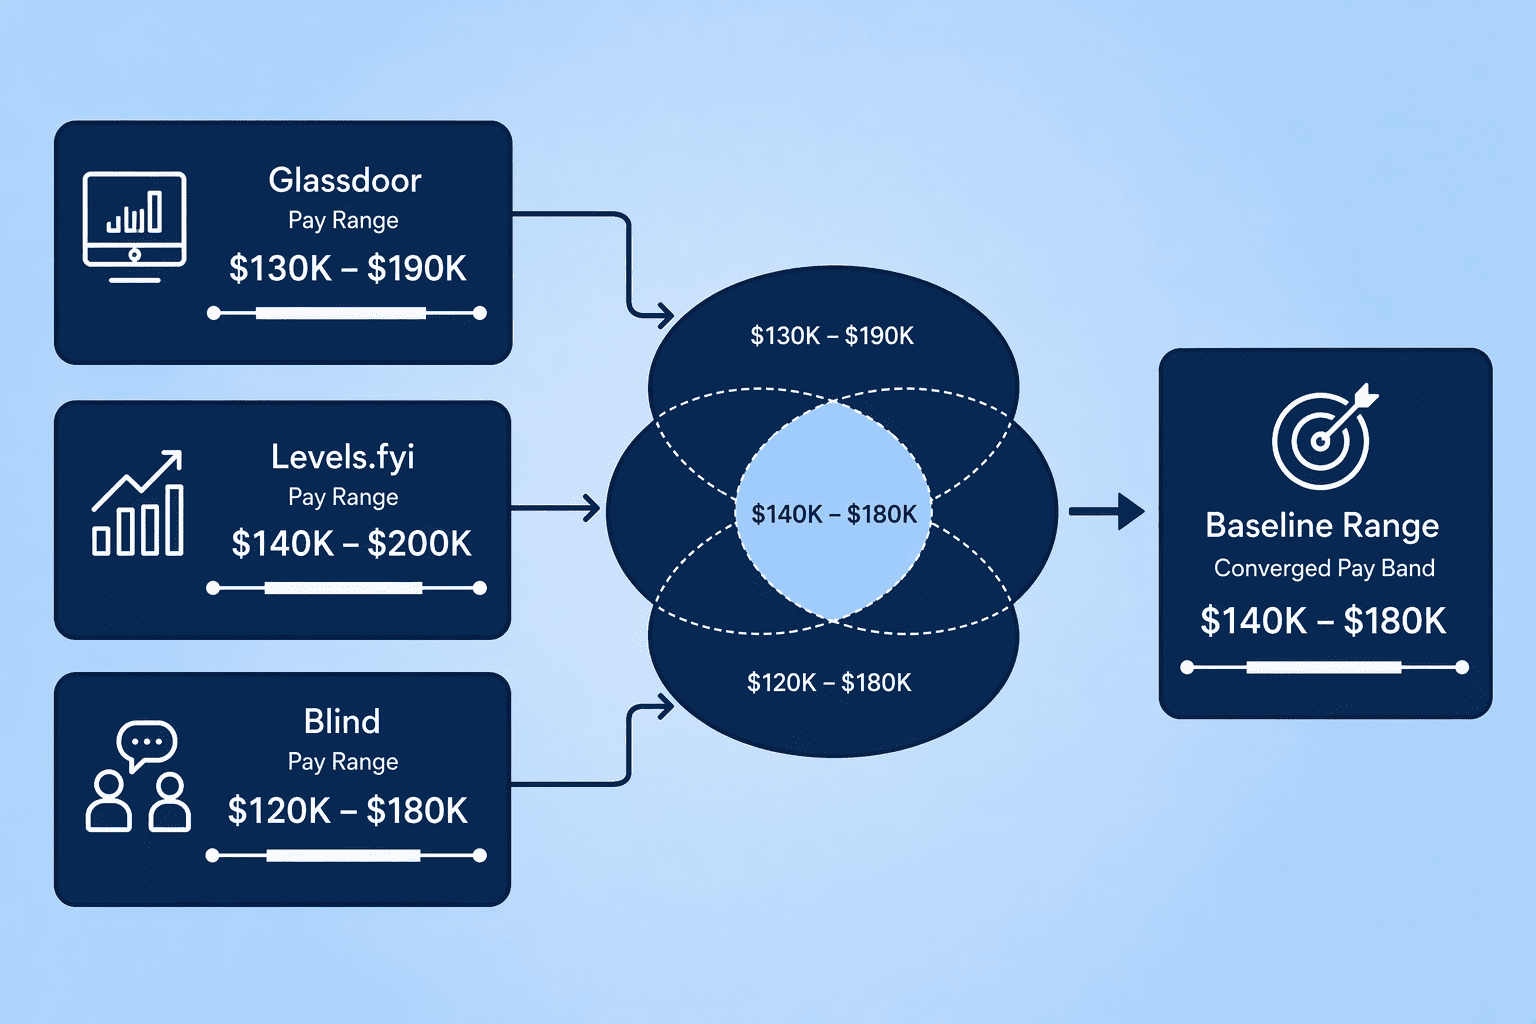
Start with a range, not a single number.
Each platform sees a different corner of the market. Glassdoor pulls from a broad corporate pool. Levels.fyi breaks down full compensation data for tech, including equity and bonus breakdowns.
Blind captures sentiment from people inside specific companies, right now. Look for the overlap. When Glassdoor, Levels.fyi, and Blind all land in the same band, maybe $130,000 to $150,000 for your role and level, you have a working baseline.
A single platform sitting $40,000 above the other two is noise. Ignore it.
Market aggregates tell you what the industry pays. Employer-specific disclosure data tells you what your prospective company has paid for your exact role. That distinction creates negotiation use.
The Bureau of Labor Statistics Occupational Employment and Wage Statistics (BLS OEWS) publishes metro-area pay bands by occupation. The Office of Foreign Labor Certification H-1B database lists filed salaries by job title, employer, and worksite. Both datasets carry a one-to-two-year reporting lag.
H-1B data covers only roles the employer sponsors. But the figures are legal disclosures, not self-reported surveys.
Cross-reference the two. When you know the employer filed a prevailing wage of $142,000 for a Senior Analyst in Dallas last year, your opening counter is grounded in their own paperwork.
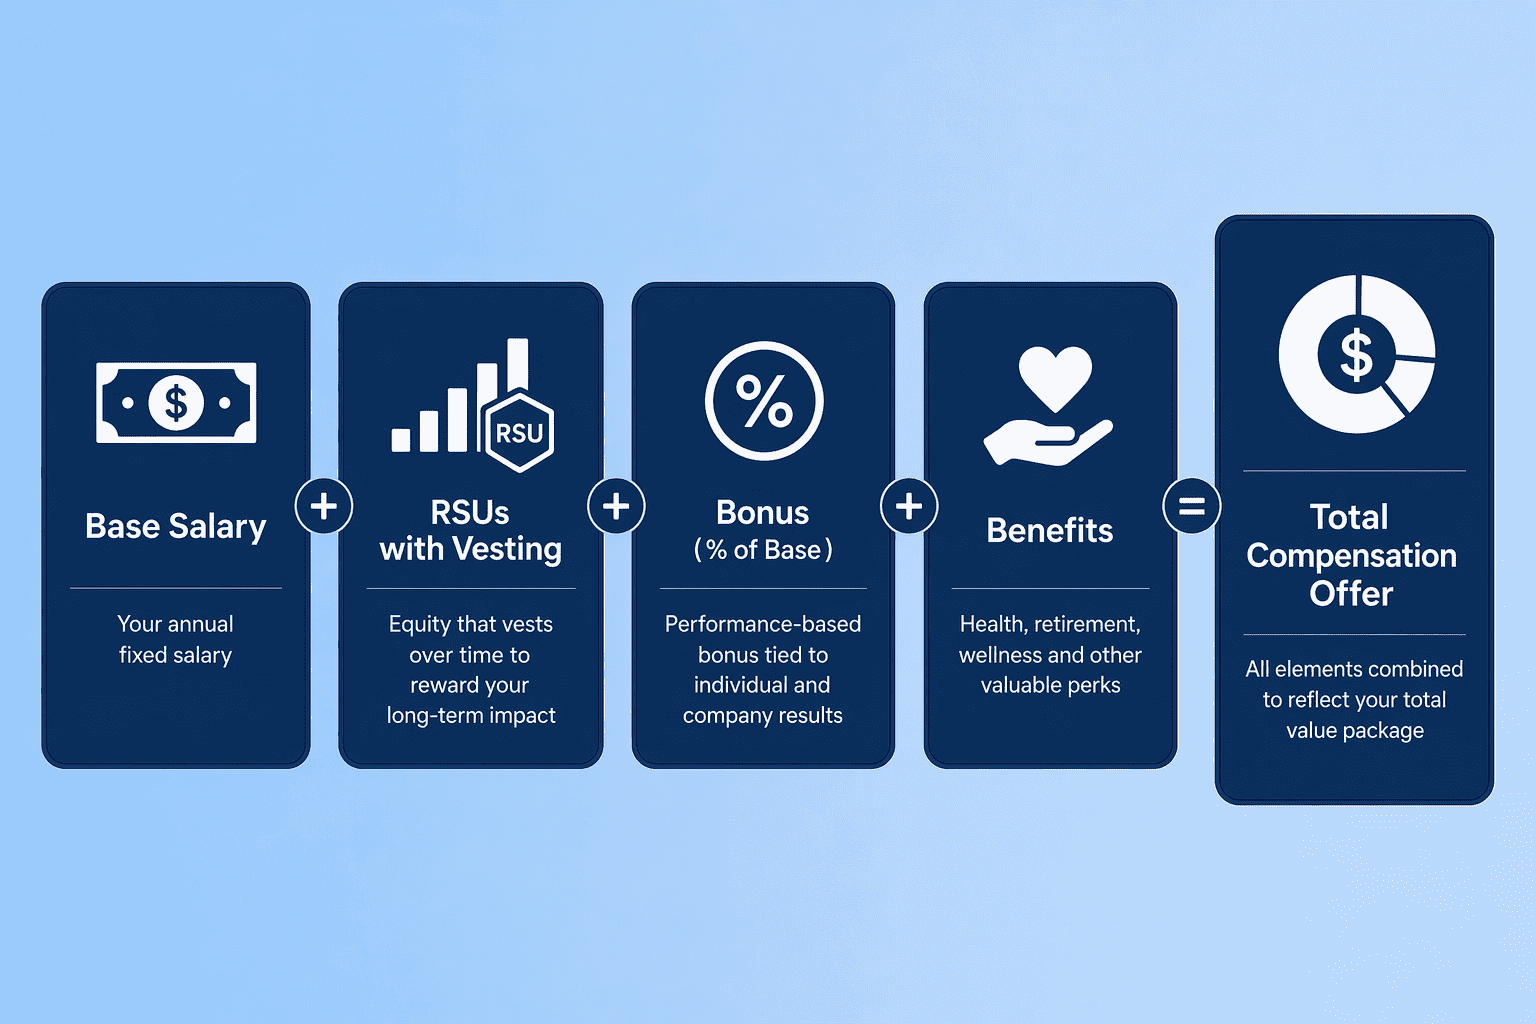
Base salary is the visible structure. The rest of the offer hides in equity schedules, performance multiples, and employer-paid benefits. Harvard career advisors frame this clearly: total compensation equals money plus benefits plus opportunity.
Work line by line. For equity, pin down the number of RSUs or options, the vesting schedule, the current valuation, and the four-year grant value. Levels.fyi gives you the granular data.
For performance bonuses, find the target percentage: a 15 percent target on a $150,000 base adds $22,500. Signing bonuses often fall between 5 and 15 percent of base. Factor in the employer's 401(k) match, because it turns into immediate tax-advantaged cash, and value the health plan by comparing annual premium costs against a marketplace benchmark.
Stack these into one total-comp figure. A $150,000 base with a 15 percent bonus target, $40,000 in annual equity vest, a 6 percent 401(k) match, and a signing bonus hits a $240,000-plus package. Negotiating on base alone misses the full picture.
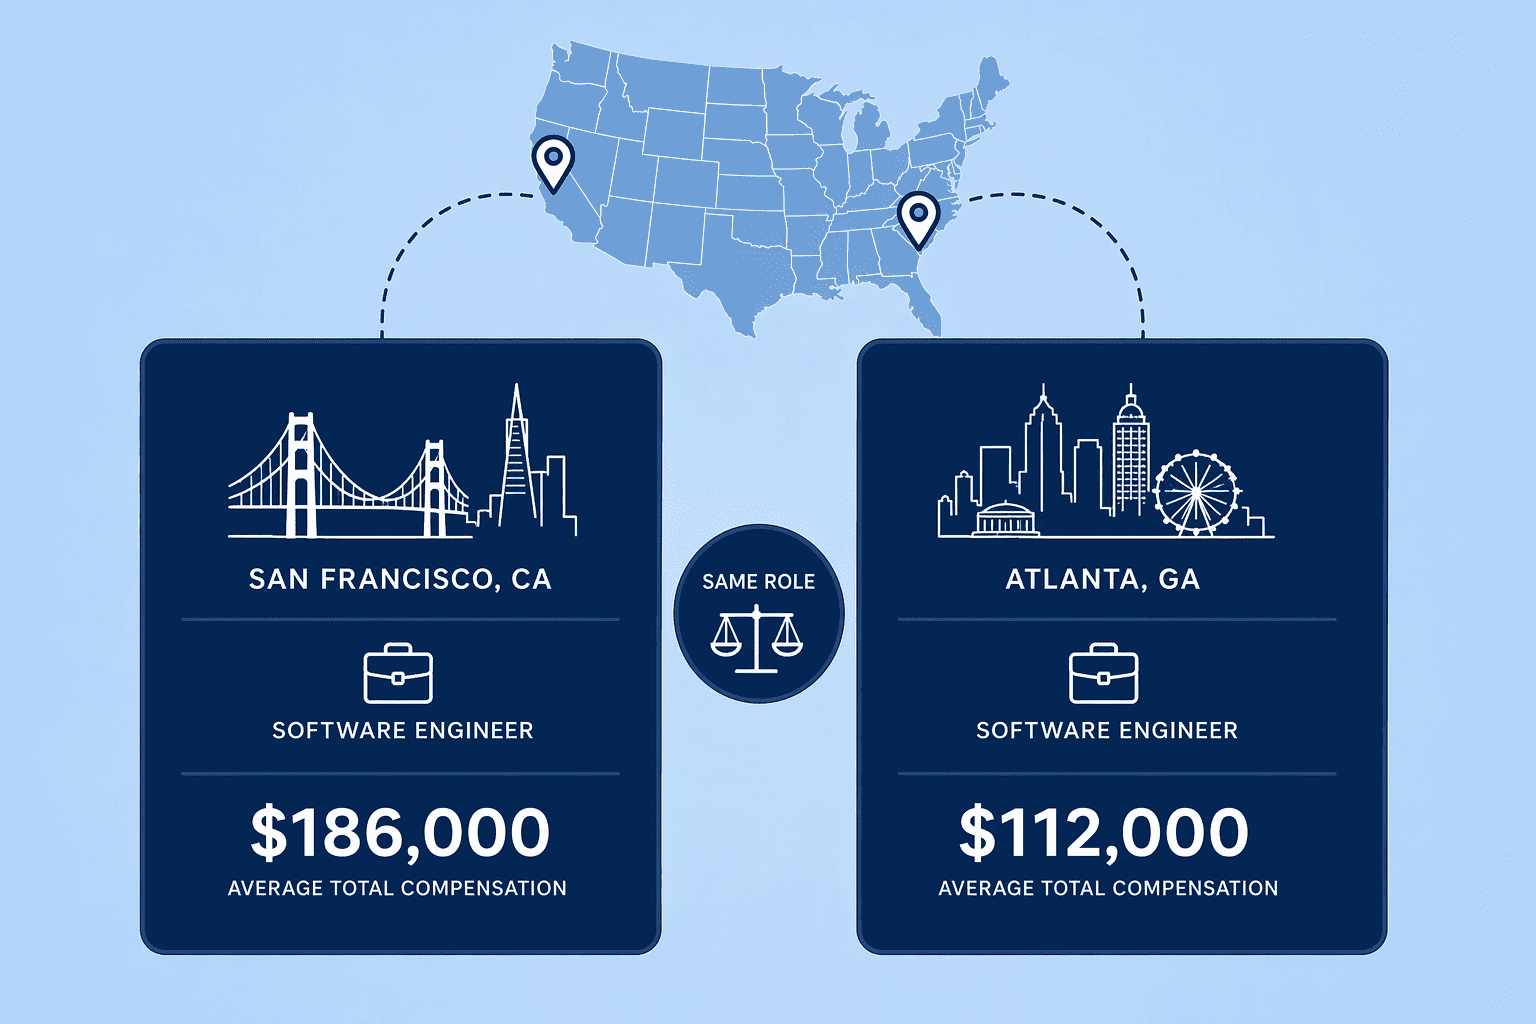
Geographic pay-blindness is the fastest way to misprice yourself. A software developer in San Francisco commands a median around $193,000; the same title in Atlanta runs closer to $122,000. That is a 58 percent gap for identical work.
The BLS OEWS Metropolitan and Nonmetropolitan Area estimates let you pull role-specific wage data for the employer's actual worksite. This is a cost-of-labor adjustment, not a cost-of-living adjustment. Employers pay based on what local talent markets demand, not what your rent costs. Here is how the distinction breaks down:
| Factor | Cost of Labor | Cost of Living |
|---|---|---|
| What it measures | What employers pay for talent in a local market | What individuals spend on housing, food, and taxes |
| Who it matters to | Employers setting salary bands | Individuals budgeting personal expenses |
| Data source for negotiation | BLS OEWS metro-area wage estimates | Personal budget and CPI-U data |
| Relevance in a negotiation | High: it anchors the employer's pay band | Low: it reflects your personal spending, not market rate |
When you are remote, check whether the employer adjusts pay by geographic tier. If they do, quote the BLS metro data for their headquarters location, not yours, to anchor the negotiation to their cost of labor.
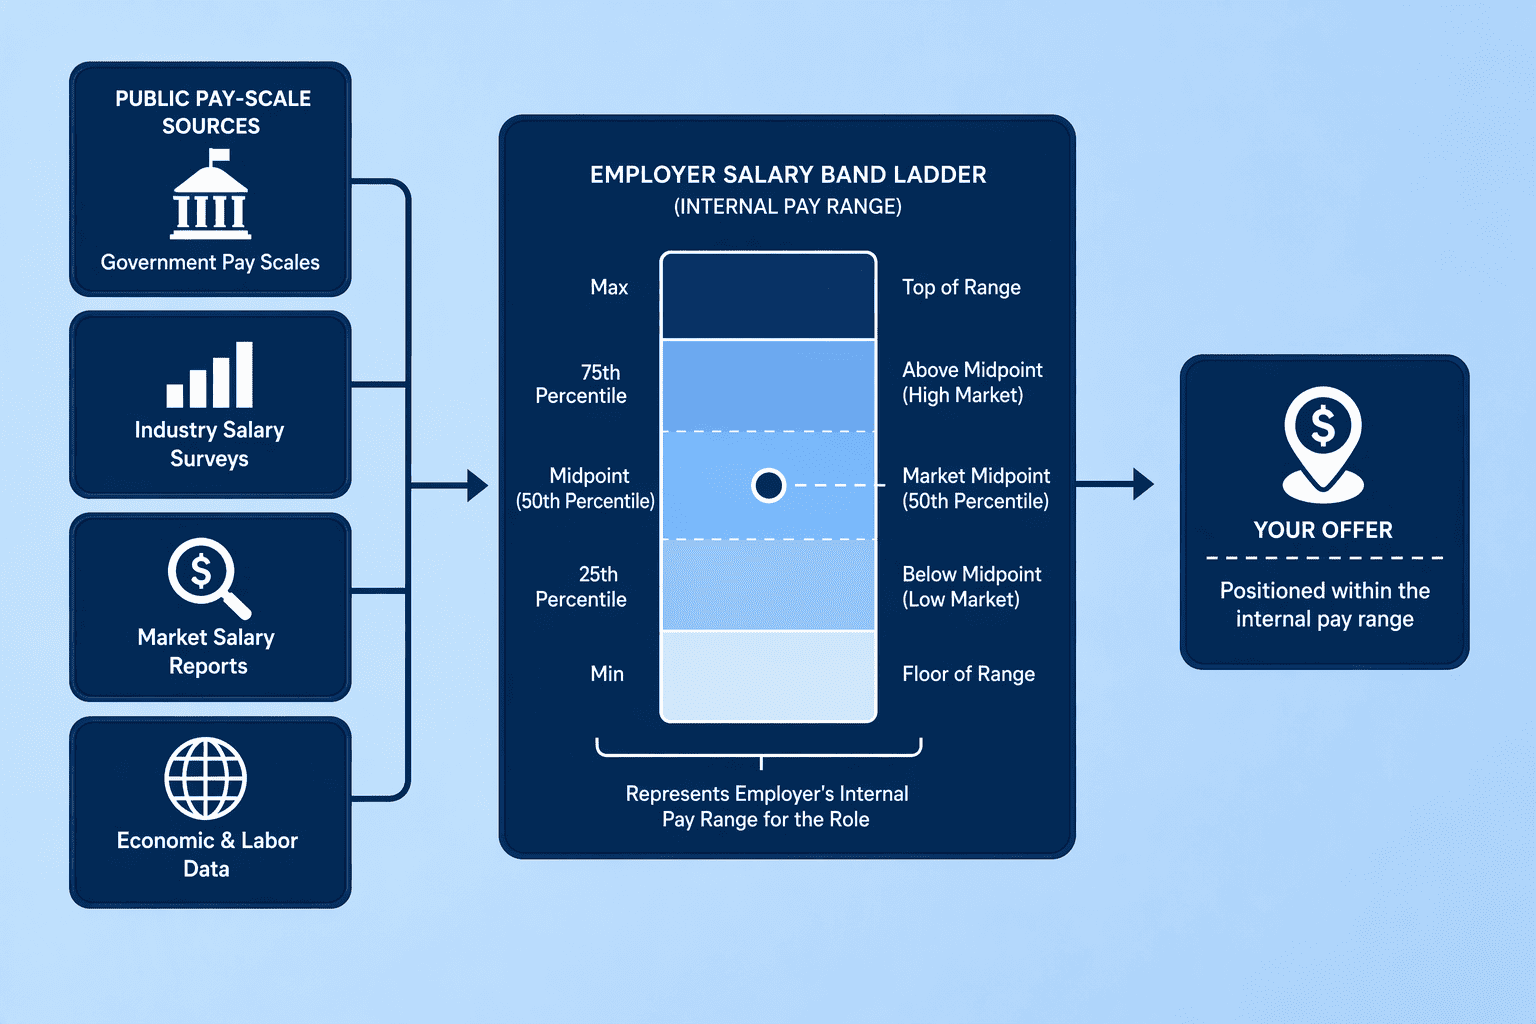
Every employer operates with internal salary bands. Your goal is to infer where your offer sits inside that range. Some transparency signals are public: federal pay scales on USAJOBS, Davis-Bacon Act wage determinations for federal contractors, and Service Contract Act prevailing wages all publish exact dollar amounts by job classification.
Three paths uncover internal band data.
Internal data is the employer's walk-away point. When you ask for the band's upper third, you push without exceeding a documented ceiling.
Raw spreadsheets do not negotiate. A brief, structured narrative anchored in specific numbers does. Harvard's career services framework advises leading with market research, and 73% of employers expect you to negotiate, so you are not offending anyone by asking.
Script the conversation in three moves. First, state a data point that brackets the bottom of your range: "BLS OEWS data places the median for this role in this metro at $148,000." Second, add the specific employer data: "H-1B filings for this title at [Company] show a filed wage of $152,000 last year."
Third, state your ask clearly: "Given that bracket and the total-comp valuation I have built, I am asking for $155,000 base plus the standard bonus and equity package." Write this on a single page alongside your line-by-line total-comp calculation. The document anchors the conversation in evidence, not emotion.
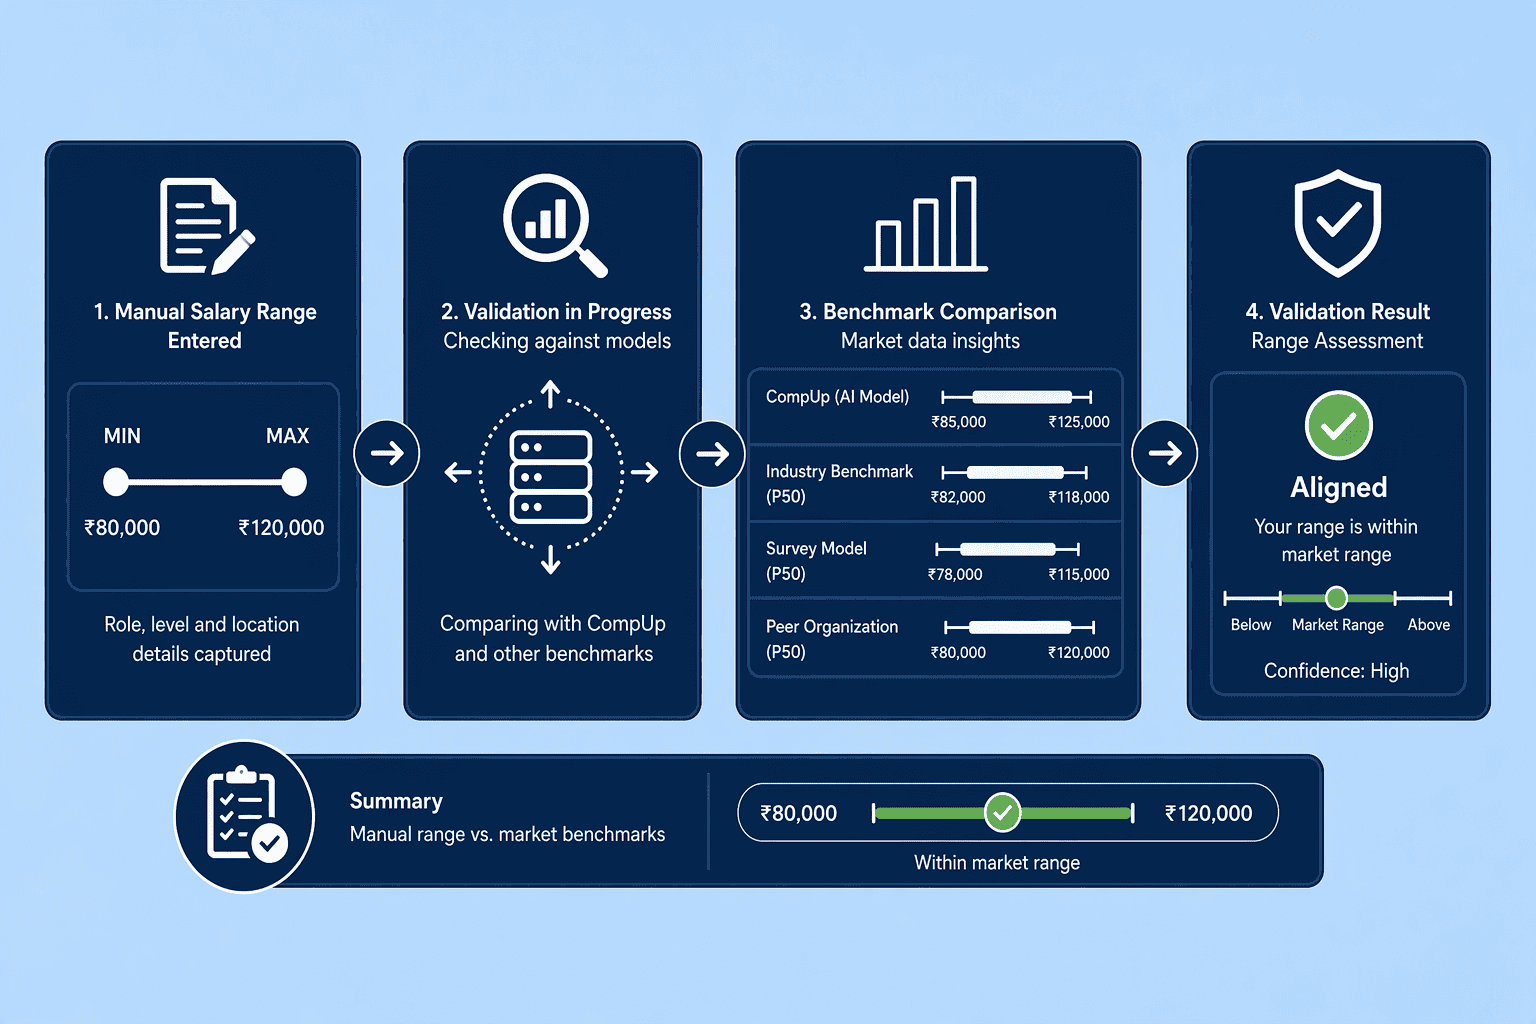
Your manual research is solid now, but a synthetic check catches blind spots. Platforms like Levels.fyi's personalized tool and TryArial.com model market value against role, experience, and location data to surface outliers you may have missed.
CompUp, for instance, lets you benchmark against industry-specific compensation data in real time. Plug in your manual range and let the platform test it against aggregate models. This final validation step is your backstop.
You started with anxiety and a single number on an offer letter. You finish with a one-page brief that pulls federal wage data, employer-specific filings, total-comp valuations, and geographic adjustments into one place. That difference, from emotional guesswork to data-driven confidence, is the whole game. Finalize your evidence document and schedule the conversation. If you're weighing options, CompUp is worth a closer look.
Triangulate three data sources to eliminate single-source bias:
Start with these three sources in order:
External market data reflects what comparable roles pay industry-wide across multiple employers. Internal pay equity analysis reveals what one specific employer pays current employees in similar roles, accessible through public-sector pay scales, federal contractor wage determinations, and employee self-reports on Blind.
Build a single total-comp figure by adding these components:
Total rewards often represent 20 to 40 percent beyond base salary alone.
Three core data sources anchor your research:
Lead with two or three specific sourced data points that bracket your desired range, then state your ask explicitly. Prepare a one-page evidence document. For example, cite BLS metro median and H-1B employer-specific figures, then deliver your number clearly and without apology.
Community Manager (Marketing)
As a Community Manager, I’m passionate about fostering collaboration and knowledge sharing among professionals in compensation management and total rewards. I develop engaging content that simplifies complex topics, empowering others to excel and aim to drive collective growth through insight and connection.
Revolutionizing Pay Strategies: Don't Miss Our Latest Blogs on Compensation Benchmarking