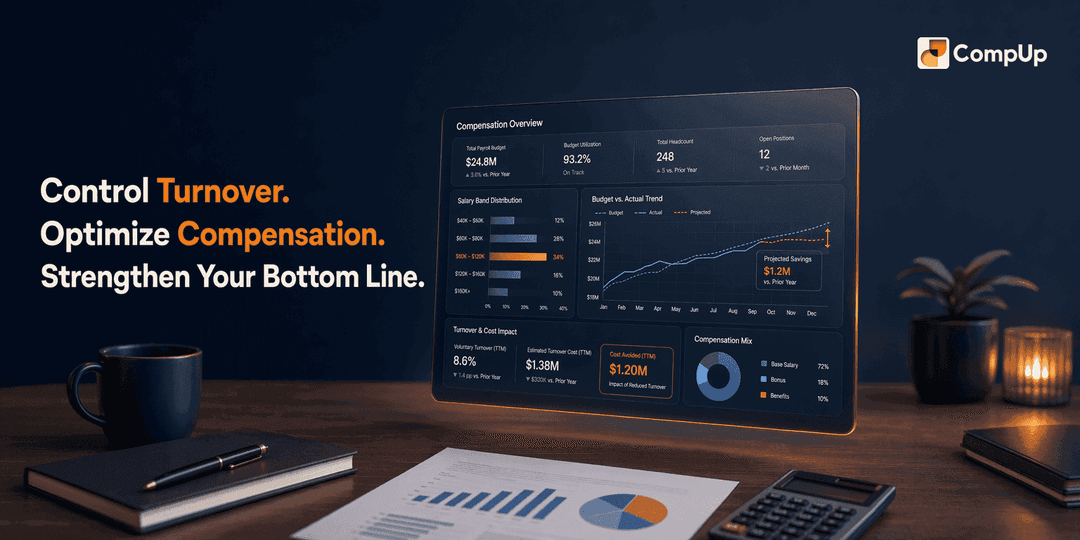

An employee resigns. It happens quietly, often after months of silent disengagement. The real shock hits when finance calculates the replacement cost. Turnover can cost an organization 1.5 to 2 times the employee's salary. For a professional earning $80,000, that is a $120,000 to $160,000 drain on the budget, consuming funds that could have funded merit increases or new hires.
Yet this hemorrhage continues because core planning remains broken. Less than 50% of companies have a strategic compensation plan. Most HR teams still wrestle with fragmented spreadsheets and disconnected data sets, leaving them too slow to correct inequities or counter a competitor's offer. The 2024/2025 planning cycle demands a cleaner operating model.
Your compensation strategy sits on a foundation of complex data that demands structure. You need benchmark sources like the Bureau of Labor Statistics, PayScale, and SalaryExpert to anchor your ranges. You need a framework that balances internal equity, external competitiveness, and geographic differentials. This guide analyzes the eight planning tools that apply that structure, moving you from reactive firefighting to proactive budget control. By comparing platforms built for end-to-end orchestration, enterprise data intelligence, and scenario modeling, you can identify the software that matches your organizational complexity.
Smart compensation budgeting in 2025 requires tools that do more than store salary figures. Before diving into the platform breakdown, here are the core findings from our analysis:

CompUp replaces the static spreadsheets and disconnected point solutions that slow down the compensation lifecycle. It is built for HR teams that need one platform to carry planning from the first budget draft to the last personalized total rewards statement.
The table below shows how a unified platform handles the core stages of planning compared to a fragmented manual process:
| Planning Stage | Fragmented Manual Process | CompUp Unified Platform Approach |
|---|---|---|
| Budget Allocation | Static spreadsheets passed via email; version control issues and formula errors cause drift. | Centralized budget pools that integrate with existing HRIS and payroll systems for real-time visibility. |
| Approval Workflows | Manual manager sign-offs via email chains; no audit trail leads to compliance gaps. | Automated approval workflows that route proposals to the correct level, preserving a strict audit trail. |
| Total Rewards Communication | Generic increase letters generated manually; no visibility into the full value of benefits and equity. | Automated, personalized total rewards statements generated instantly at the close of the appraisal cycle, capturing salary, bonuses, and benefits. |
| Pay Equity Analysis | Periodic, manual audits that scan for obvious gaps, often stale by the time they are reviewed. | An embedded Pay Equity feature that identifies and addresses pay gaps across demographics as budgets are modeled. |
| Global Coordination | Currency conversion errors and missed geographic differentials due to siloed local data. | Native multi-currency support for global teams that standardizes planning across regions. |
PayScale starts with a simple idea: a job title is not a price tag. The company's AI pulls apart roles by skill set, industry, and location to build market rates that match the specific profile you are hiring, not some national median.
A 'Senior Software Engineer' in Austin costs one thing. The same title in San Francisco costs something else. Add a specific programming language, and the number moves again. PayScale's model works through those layers so you get a rate tied to the actual role you need filled.
That external data changes how you plan. You set a band midpoint and immediately see where your current team falls. Then you steer merit increases toward the people sitting furthest below market. Salary benchmarking involves comparing compensation packages offered by similar companies in the industry and geographical location, and PayScale handles that comparison without manual lookups.
PayScale focuses on one job and does it well. It gives you the market number. It does not manage approvals, it does not push the final offer to the candidate, and it does not track the whole compensation cycle. The tool earns its place when its data feeds into a wider system that handles everything else, supplying the market signal that makes your offers competitive.
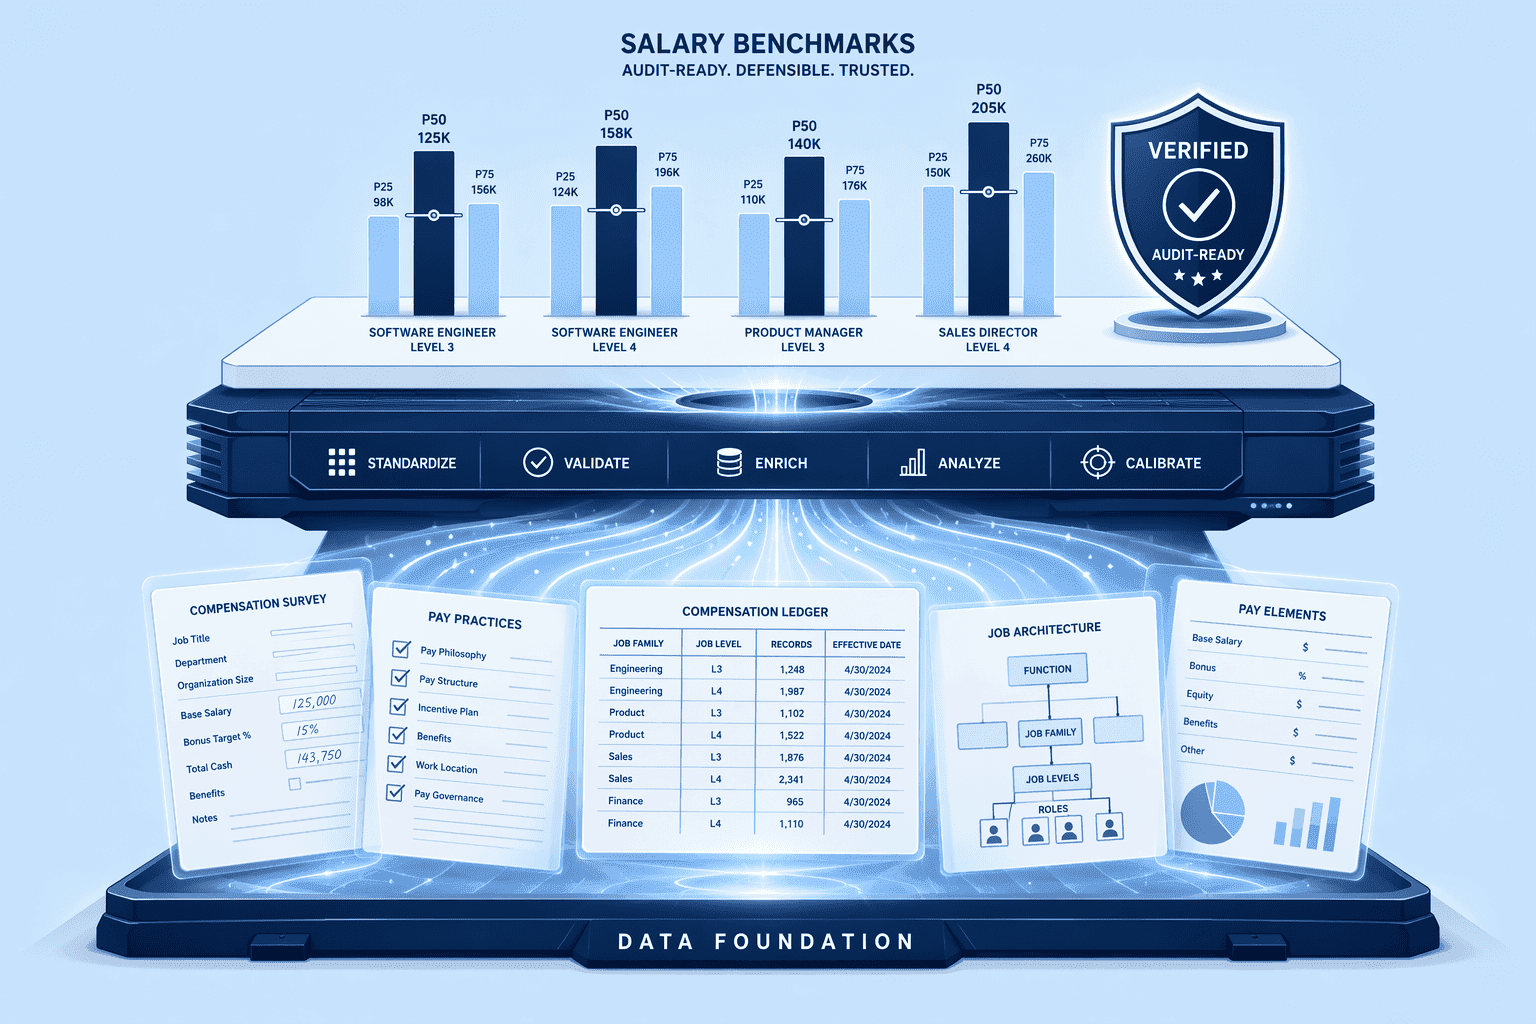
Salary.com runs on a different kind of trust. Its CompAnalyst platform pulls from one of the largest collections of employer-reported surveys available. A large enterprise bracing for a pay equity audit or presenting comp structures to a board doesn't need a sleek dashboard first. It needs data that holds up under scrutiny. Benchmarked salary figures will fit into a range determined by researching and comparing a variety of sources, and Salary.com supplies the dense source material that range is built from.
CompAnalyst anchors your internal equity framework. When you build salary structures inside it, you map your jobs to a survey-backed taxonomy. What starts as a subjective grading conversation becomes a defensible architecture.
The platform isn't flashy. The learning curve is steeper than what you get from a lightweight startup tool. If you are planning compensation for thousands of employees across dozens of job functions, the core requirement isn't UI polish. It's data governance. Salary.com makes sure the range for a Grade 11 Analyst rests on statistical evidence, not office politics.
For multinationals, the gap between a compensation plan and a payslip is a minefield of compliance failures. ADP's Compass closes that gap.
Compass uses ADP's existing human capital management setup to turn a budget model into executable payroll without delay. You can run a merit cycle, model the impact of a multi-currency increase for your EMEA team, check it against geographic pay differentials, and then execute the change. This closes the loop on global compensation modeling, removing the risk of a spreadsheet error cascading into incorrect payments. It is a native advantage that standalone planning tools cannot replicate because they sit outside the core pay engine. For large employers already running ADP for payroll, this is the most logical path to tighter control and data accuracy.
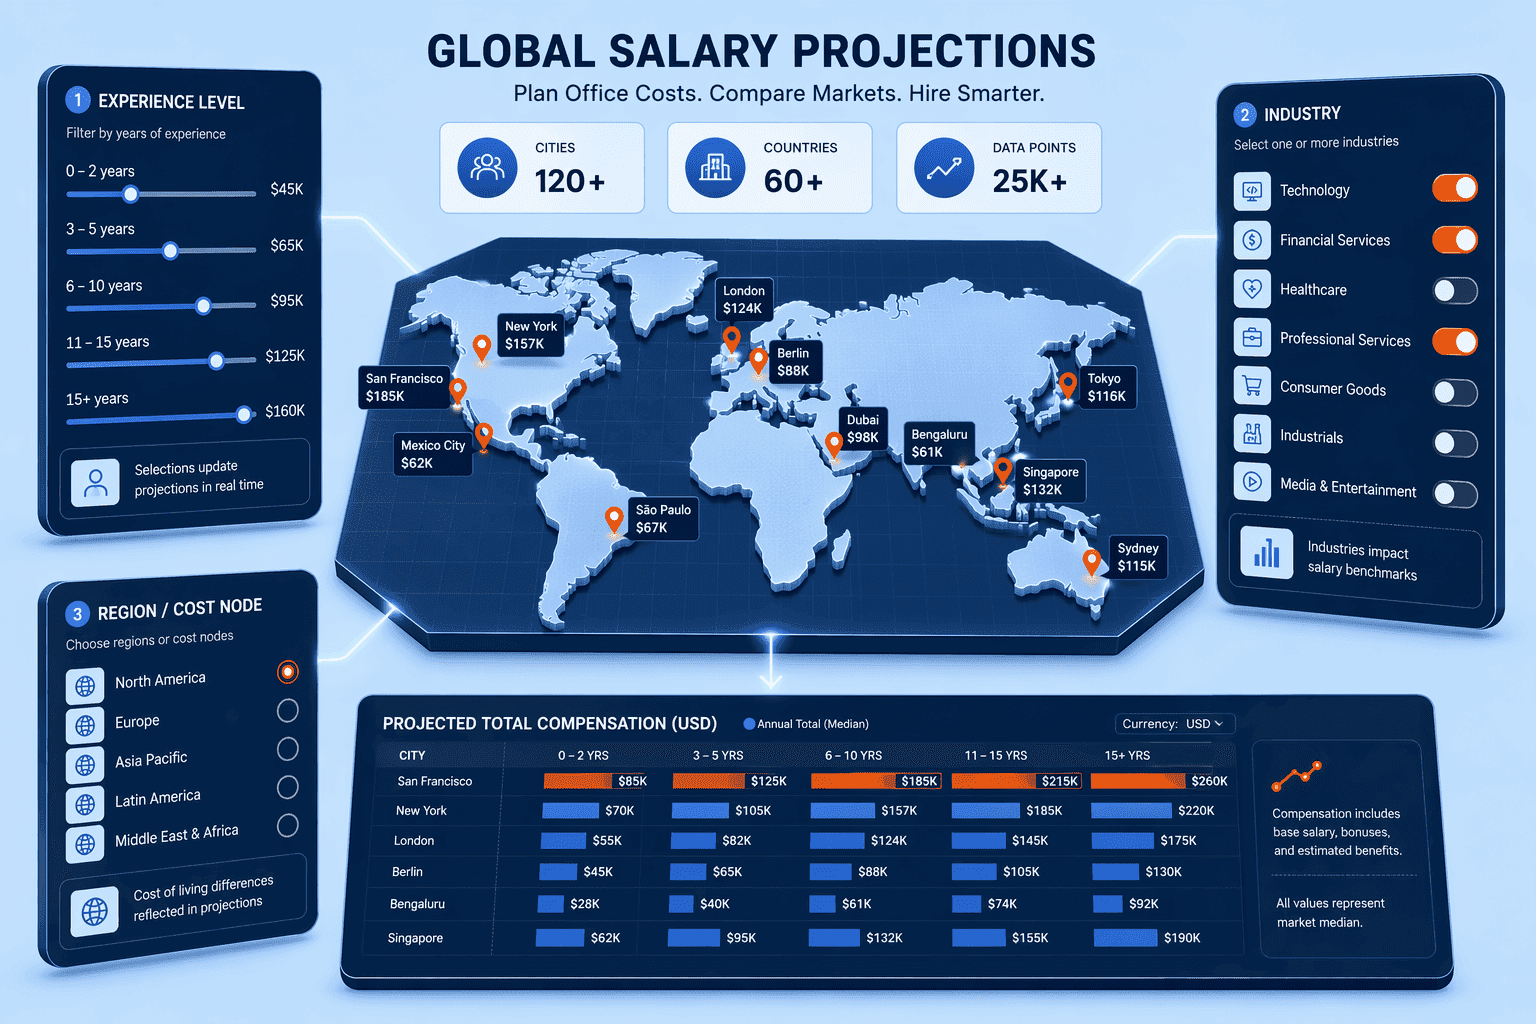
Compensation analysts often struggle to project costs for a new office they have never operated in before. SalaryExpert addresses this blind spot with geolocated data specificity. By drawing on sources including the Bureau of Labor Statistics, which provides wage, salary, and benefits data by region and sector, the tool lets you isolate cost drivers by city, experience level, and industry. Use the table below to compare how SalaryExpert refines a global budgeting assumption versus a generic market estimate:
| Budgeting Task | Generic Market Estimate | SalaryExpert Granular Reporting |
|---|---|---|
| New Office Cost Projection | Uses a single national average salary figure, which can miss severe metro-specific premiums. | Generates a detailed report isolating labor costs by specific city and experience tier. |
| Benchmark Calibration | Relies on a narrow data set from a single survey, risking unrepresentative compensation bands. | Cross-references data from BLS and other sources to build a range supported by multiple data points. |
| International Market Entry | Lacks confidence in international data, often relying on expensive one-off consultant studies. | Provides standardized reports across global locations, making it easier to compare labor costs side-by-side. |
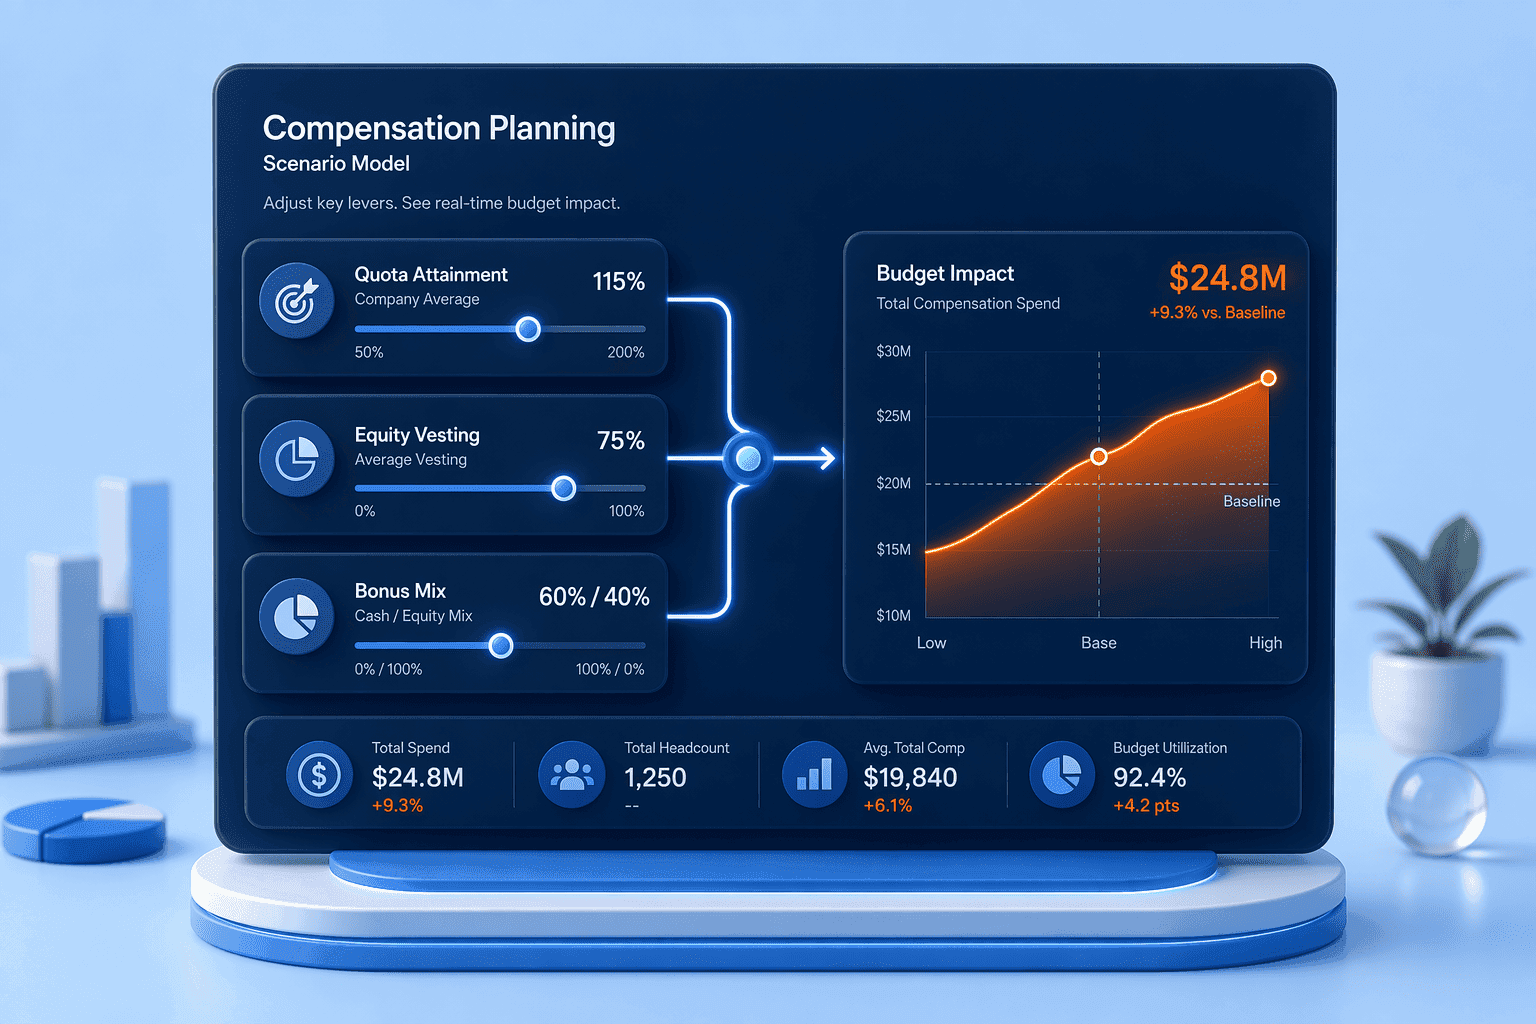
Standard compensation planning breaks down when you move past a simple base salary increase. Sales incentive plans, equity grants, and long-term bonus accruals create multi-variable cost structures that a rigid grid cannot model. Payfactors is designed for that complexity. Its core value is the free-form scenario builder, where you adjust multiple levers, like quota attainment, equity vesting schedules, or a shift in bonus mix, and instantly see the total budget impact.
This is 'what-if' analysis for industries where a single bad comp plan can blow up a P&L. You can model a 'bear case' scenario where commission attainment drops by 10% to see if your plan costs remain safe. Or you can test how accelerating equity grants for a critical talent segment affects your long-term dilution and cash budgets. Technology enables compensation planning through data gathering and analysis, evidence-based insights, and scenario modeling to assess potential impacts. Payfactors is the most direct expression of that 'assess potential impacts' capability I have seen in a planning tool, provided your organization has the analytical talent to manipulate the variables correctly.
Most planning tools answer a single question: 'How much will we spend?'
Mercer Comptryx answers a sharper one: 'What are we buying with that spend?' It is a platform for total rewards leaders who need to connect compensation spend to workforce outcomes. Comptryx maps your pay data against workforce analytics to visualize the total cost of rewards and identify concrete threats.
It surfaces where pay discrepancies may exist between longer-term employees and new hires, or between demographic groups, which can lead to dissatisfaction and turnover. By moving past simple budgeting and into analytics on pay equity and workforce costs, it gives a CHRO more than a spending target. You get a strategic risk assessment and a model for the returns on total rewards investment.
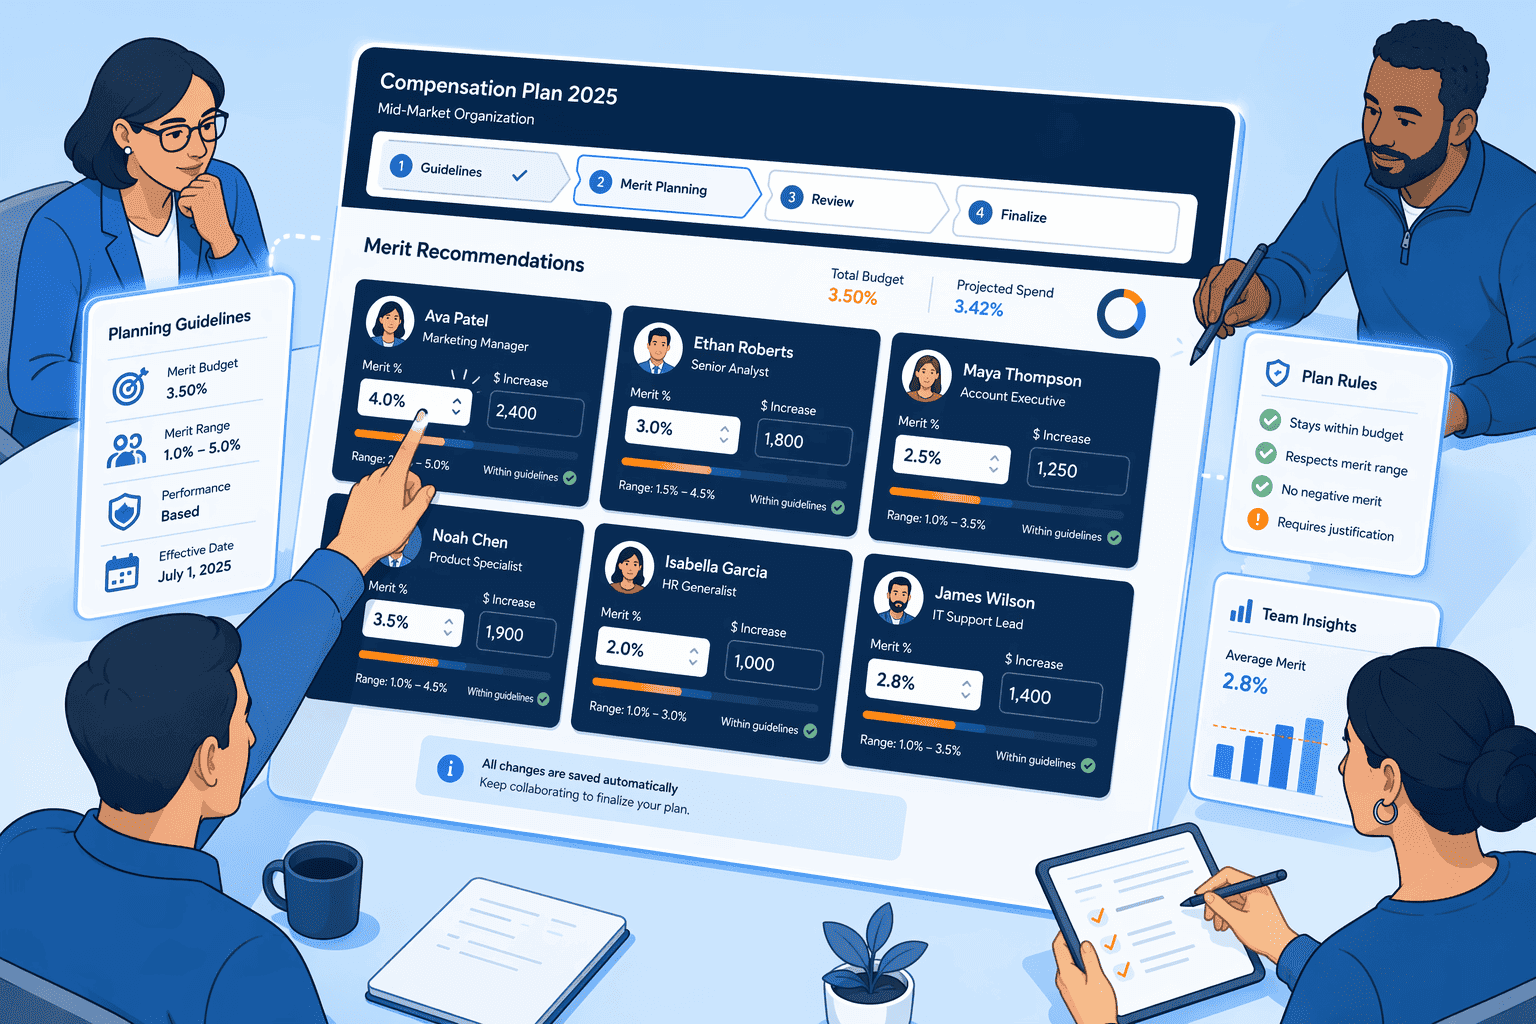
The mid-market often lives in a painful gap. Companies are too complex for a single HR manager to run compensation in memory, yet not ready for the six-figure cost and six-month deployment of an enterprise suite. Their process typically starts and ends with a master spreadsheet, which immediately breaks when ten line managers want to enter merit recommendations simultaneously.
CompensationXL addresses that specific pain. It replaces the static spreadsheet with an agile, collaborative platform designed for line manager workflows. Instead of chasing down version 12 of a budget workbook, a comp admin configures the pool, and managers log in directly to enter their recommendations.
This cuts the cycle time dramatically. Mid-market firms making the leap from Excel get a lightweight governance layer: controlled access, real-time budget roll-ups, and an end to formula corruption. The tool is easy for the comp admin running the cycle and the manager allocating recommendations, a meaningful upgrade over the status quo.
It does not seek to be an enterprise data lake or an AI benchmark engine. It focuses on workflow hygiene, making the core process faster and more accurate.
Start with a salary survey to anchor your ranges. Run the cycle inside a system that talks to payroll. Then pull the numbers into a model that tells you whether the spend actually moved retention or performance.
That sequence sounds linear on paper. It rarely is in practice. You will find yourself buying capability in the order your current mess demands. A company whose spreadsheets break every cycle under version conflicts cares more about collaboration controls than advanced analytics. A multinational with five payroll systems and no single source of truth needs a closed budgeting loop before anything else.
The question that cuts through the list is simple: what forces you to redo work today? If the board asks why total rewards costs grew while regrettable attrition stayed flat, skip the workflow tools. You need scenario models that connect a five percent merit pool to the turnover probability of your top quartile. If managers submit spreadsheets you cannot aggregate without three days of manual cleanup, start with the survey data and plan distribution pieces. Precision analytics on dirty input is still noise.
Chase the capability that solves the one constraint costing you the most time and credibility right now. The rest can wait. If you're weighing options, CompUp is worth a closer look.
Compensation planning is the strategic process of designing and managing a total rewards program, including salary, bonuses, and benefits, to support business strategy. It is critical because poor planning directly causes turnover, which can cost 1.5 to 2 times a departing employee's salary in lost productivity and replacement expenses.
A typical compensation planning process follows four sequential steps:
Effective compensation planning requires balancing several key factors:
Tools improve accuracy by replacing static, error-prone spreadsheets with centralized data. They automate market pricing, model 'what-if' scenarios instantly, enforce approval workflows to prevent rogue spending, and conduct pay equity analysis to spot and fix gaps before they become legal risks.
Key 2025 trends and best practices include:
Community Manager (Marketing)
As a Community Manager, I’m passionate about fostering collaboration and knowledge sharing among professionals in compensation management and total rewards. I develop engaging content that simplifies complex topics, empowering others to excel and aim to drive collective growth through insight and connection.
Revolutionizing Pay Strategies: Don't Miss Our Latest Blogs on Compensation Benchmarking