
The spreadsheet breaks again. A talented engineer walks out the door, telling exit interviewers she never understood the company was contributing 19.98% to her retirement. Your sales team grumbles about unclear variable comp structures on anonymous review sites. Meanwhile, HR invests 200 hours annually assembling static PDFs that employees glance at once and forget.
The disconnect between employer investment and employee awareness creates unnecessary turnover risk.
Personalized total rewards statements bridge that gap. They translate compensation packages—base salary, bonuses, equity, health coverage, retirement matches, perks—into clear, individualized summaries. Instead of relying on vague talking points about company culture, you show employees concrete numbers that demonstrate real value.
Understanding the concept is straightforward. Executing it for hundreds or thousands of employees is where things fall apart. Modern software platforms transform total rewards from a once-a-year communication burden into an ongoing retention mechanism powered by live data integration. Below are the eight platforms leading the space in 2026.
Each platform excels in a distinct category, making selection easier when you match your primary challenge to the right tool.
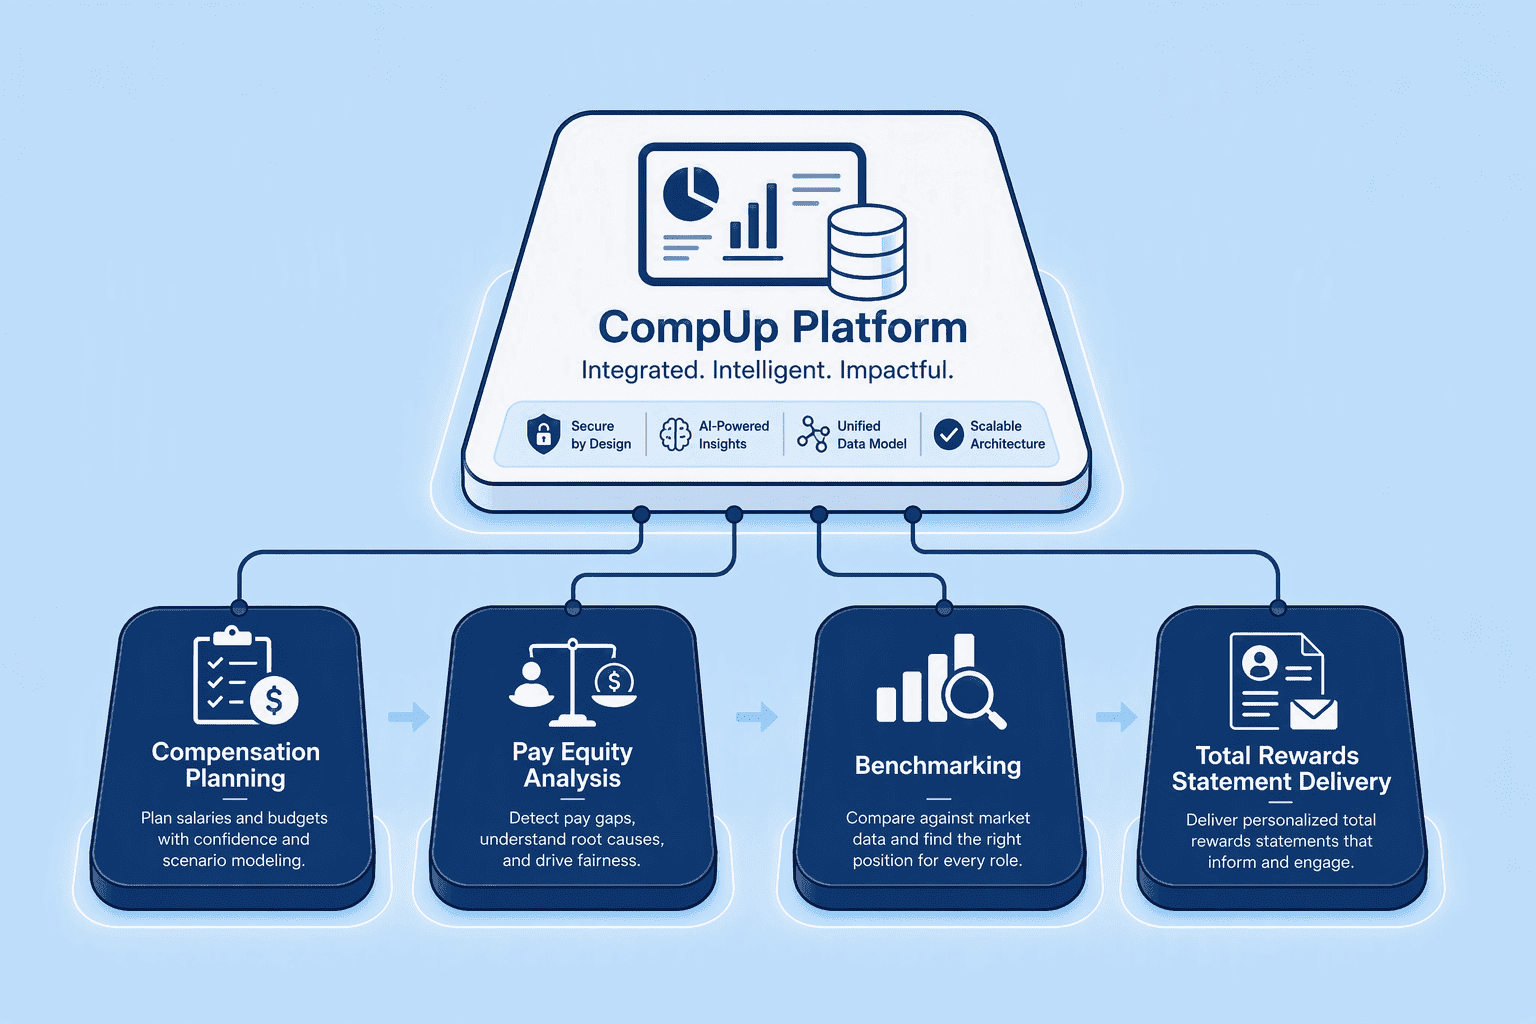
CompUp consolidates compensation planning, benchmarking, and total rewards communication into a unified system. Instead of managing these as separate processes, teams work within a single interface where planning decisions flow directly into employee statements. Pay equity analysis happens during the budget cycle, not after statements have been distributed, allowing teams to identify and address disparities proactively.
The platform connects planning workflows with communication outputs, reducing the manual reconciliation work that typically consumes compensation teams. Data validation happens automatically as information flows from payroll, equity administration, and benefits systems into statement templates. For organizations managing compensation across multiple data sources, CompUp offers a practical alternative to spreadsheet juggling.
Teams that rely heavily on spreadsheets for payroll exports, equity tracking, and benefits rosters may find the integrated approach reduces manual errors.
The platform pulls compensation data streams, validates inputs, and flags anomalies before statements reach employees. Internal equity dashboards help identify pay gaps during planning phases rather than discovery phases. For teams looking to tighten the connection between compensation strategy and employee communication, CompUp provides a straightforward workflow improvement.
CompUp offers a free demo and positions itself at an accessible price point ($22). The platform acknowledges standard cloud security practices, noting that while it takes steps to protect personal information, complete protection cannot be guaranteed. Organizations seeking to reduce manual reconciliation and integrate pay equity checks into their compensation cycle may find CompUp a practical fit. Below is a breakdown of core capabilities.
| Feature | Description |
|---|---|
| Pay Equity Dashboards | Visualize compensation distribution across demographics, job levels, and departments to identify disparities during planning cycles. Built-in analytics flag potential gaps before statements are distributed. |
| Data Integration & Validation | Automated connections to HRIS, payroll, and equity systems with real-time anomaly detection to catch errors before statement generation. Reduces manual reconciliation work across multiple data sources. |
| Template-Driven Statements | Pre-built, customizable templates that pull validated data and generate personalized total rewards statements at scale. Multi-currency support and localization options for global teams. |
| Unified Compensation Workflow | Seamlessly connects compensation planning with total rewards delivery in one platform. Planning decisions flow directly into employee statements without manual export/import cycles. |
| Proactive Compliance Support | Standard cloud security practices with acknowledgment of data protection limitations. Organizations should validate alignment with their specific compliance requirements. |
| Real-Time Benchmarking | Integrated market data access to position compensation competitively. Helps contextualize total rewards packages against industry standards during the planning phase. |
| Automated Error Flagging | System identifies data inconsistencies, missing values, and outliers before statements reach employees. Reduces post-distribution corrections and support inquiries. |
HRSoft Rewards solves the equity complexity problem that overwhelms simpler statement builders. Public companies juggling multiple grant types, staggered vesting schedules, RSU projections, and performance-share scenarios need more than a single 'Equity: $X' line on a statement. That oversimplification misleads more than it clarifies. What matters to employees and executives alike is the forward trajectory: unvested balances, upcoming vesting events, and payout ranges under different performance outcomes. HRSoft models these layers with precision, pulling grant data from equity administration systems and projecting future vesting events alongside current holdings. Employees see not only what they hold today, but what they stand to gain by remaining through the next vesting cliff—a distinction that carries direct retention weight for high-value executive populations.
The platform handles benefit architectures that vary by subsidiary, country, or employee tier—deferred compensation plans, non-qualified plans, executive wellness programs—without forcing separate manual reconciliation for each variation. The output is compliant, audit-ready, and captures the full scope of enterprise compensation structures. For organizations managing sophisticated long-term incentive programs, HRSoft delivers a level of detail that generic tools cannot replicate.
This capability comes with trade-offs. HRSoft requires dedicated compensation expertise to configure and maintain. It is built for enterprise-grade compensation functions, not for lean teams at early-stage companies. Organizations with the internal resources to support it will find HRSoft a powerful tool for managing executive and equity-heavy compensation programs at scale.
ChartHop transforms total rewards statements into a live organizational intelligence layer. Instead of treating compensation as an isolated annual communication, the platform connects pay data to headcount planning, org chart visualization, and workforce analytics. Salary, equity, benefits, reporting structure, career progression, promotion history—all of it exists in a unified system that updates as the business evolves. The compensation view is one dimension of a broader people operations ecosystem, giving leadership the ability to model budget scenarios, identify retention risks, and understand how pay decisions ripple across teams.
Compensation numbers remain the same—a bonus or equity grant costs what it costs—but when those figures sit alongside tenure data, promotion velocity, and team structure, they tell a richer story. ChartHop makes compensation legible not only to the employee receiving the statement, but also to the manager trying to retain them and the executive modeling workforce costs three quarters out. For organizations seeking to integrate compensation communication with strategic people planning, ChartHop delivers context that isolated statement generators cannot provide.
CompAnalyst distinguishes itself through market data integration that most total rewards platforms cannot match. The platform draws from a proprietary database containing over 800 million HR-reported compensation data points across more than 16,000 job titles. This dataset feeds directly into individual employee statements, transforming a simple benefits summary into a market-anchored retention tool. Employees see not just their total compensation, but how that package compares to relevant market percentiles for their specific role, industry, and geography.
CaptivateIQ redefines total rewards for variable-pay populations. Rather than generating annual retrospective summaries, the platform delivers daily-updated earnings dashboards that break commission calculations down to individual deals. Sales representatives see exactly how pipeline activity converts to take-home pay in real time. This fundamental shift—from backward-looking ledger to forward-facing earnings tracker—addresses the core anxiety variable-comp employees carry: uncertainty between guaranteed base salary and actual realized income. The what-if modeling feature lets reps run earning scenarios against current pipeline, providing clarity that static PDF statements cannot deliver.
For organizations managing complex commission structures across large sales teams, CaptivateIQ eliminates the reconciliation disputes and opacity that erode trust. The platform's transparency into deal-level attribution and comp plan logic gives sales leadership a management lever that traditional total rewards tools miss entirely. Variable pay becomes visible, verifiable, and actionable rather than a black-box calculation revealed once per year.
CaptivateIQ does not cover traditional benefits like health insurance, retirement contributions, or PTO valuations. It is purpose-built for commission-heavy roles and works best alongside a broader total rewards platform that serves non-sales populations. Organizations with significant variable-pay complexity will find CaptivateIQ a category leader for that specific use case.
Aon Radford is designed for companies that want total rewards statements to draw from the same market intelligence their boards use to approve compensation philosophy. The platform feeds Radford survey data—widely regarded as the gold standard for technology and life sciences compensation benchmarking—directly into the statement module. The numbers the board sees in strategy discussions are the same numbers employees see in their personalized statements, creating alignment from executive decision-making through individual communication.
| Feature | Description |
|---|---|
| Survey-Integrated Benchmarking | Direct integration with Radford Global Compensation Database, embedding role-specific market data into every employee statement. |
| Broad-Based Equity Modeling | Tools for communicating stock options, RSUs, and ESPP value to employees unfamiliar with equity compensation, with built-in valuation scenarios. |
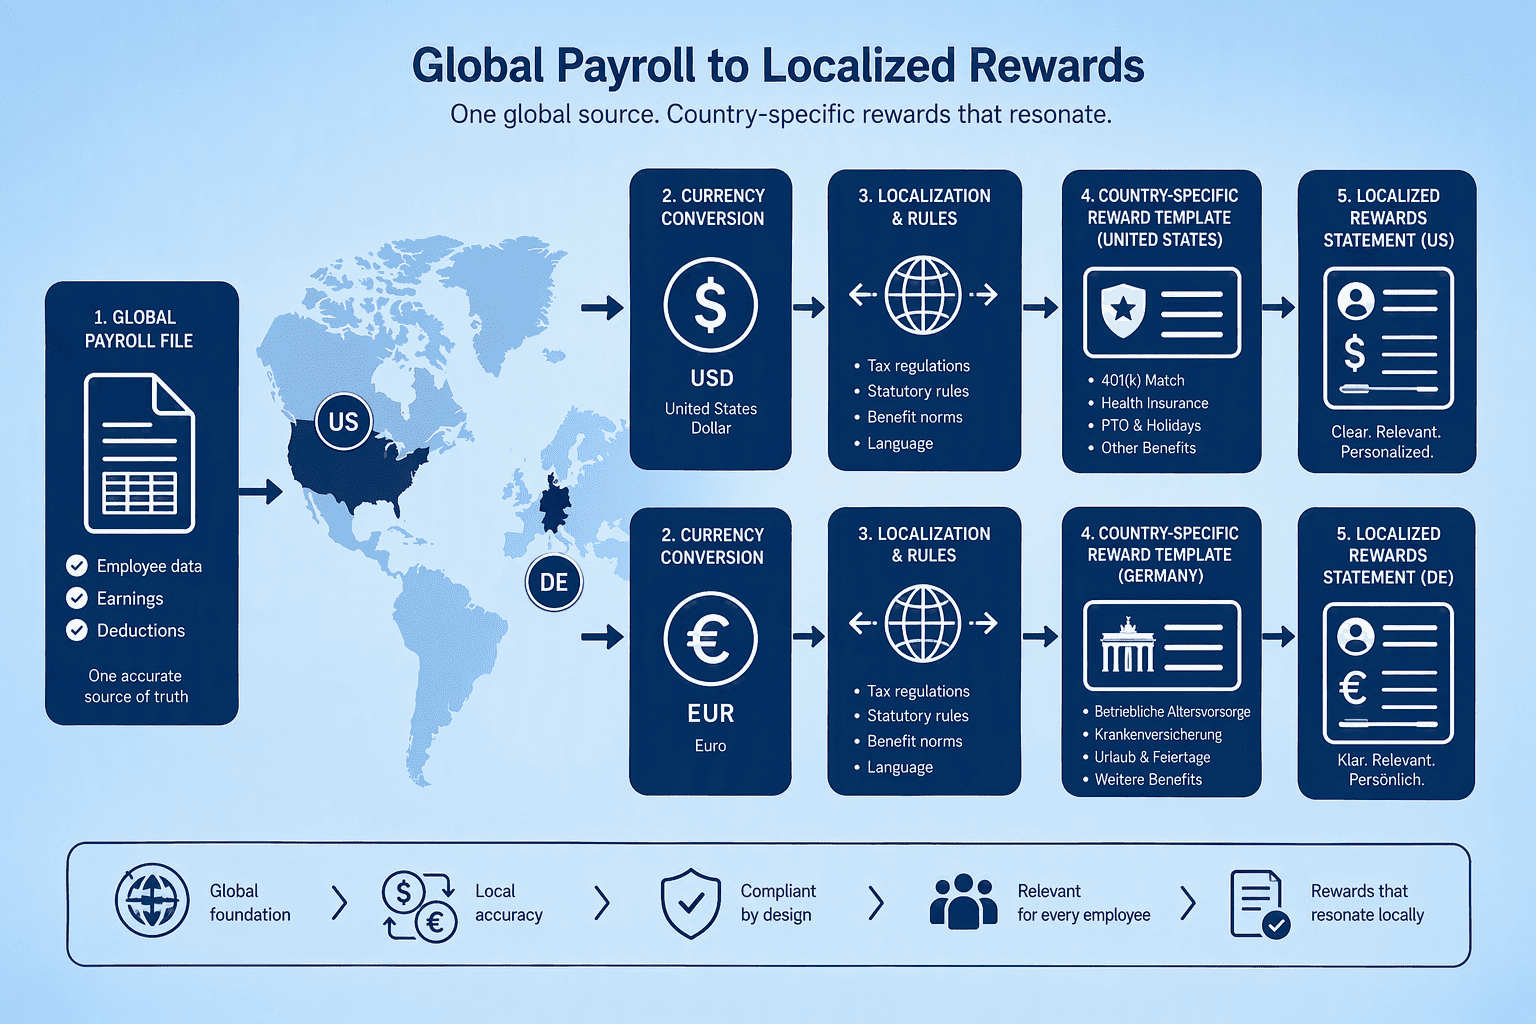
| Multi-Country Localization | Supports compensation statements across global workforces with localized market data, currencies, and regulatory compliance. |
| Board-to-Employee Alignment | Ensures consistency between executive-level compensation strategy and employee-facing communication by using a unified data source. |
Aon Radford's ecosystem works best when compensation strategy and total rewards communication share a data backbone. You avoid the friction of exporting survey results from one system into a statement builder in another. For pre-IPO companies explaining option grant value to employees who have never held equity, framing grants against validated, role-specific market data adds credibility that flat dollar amounts cannot match. Organizations deeply invested in Radford's benchmarking methodology will find the integrated statement capability a natural extension of their existing compensation infrastructure.
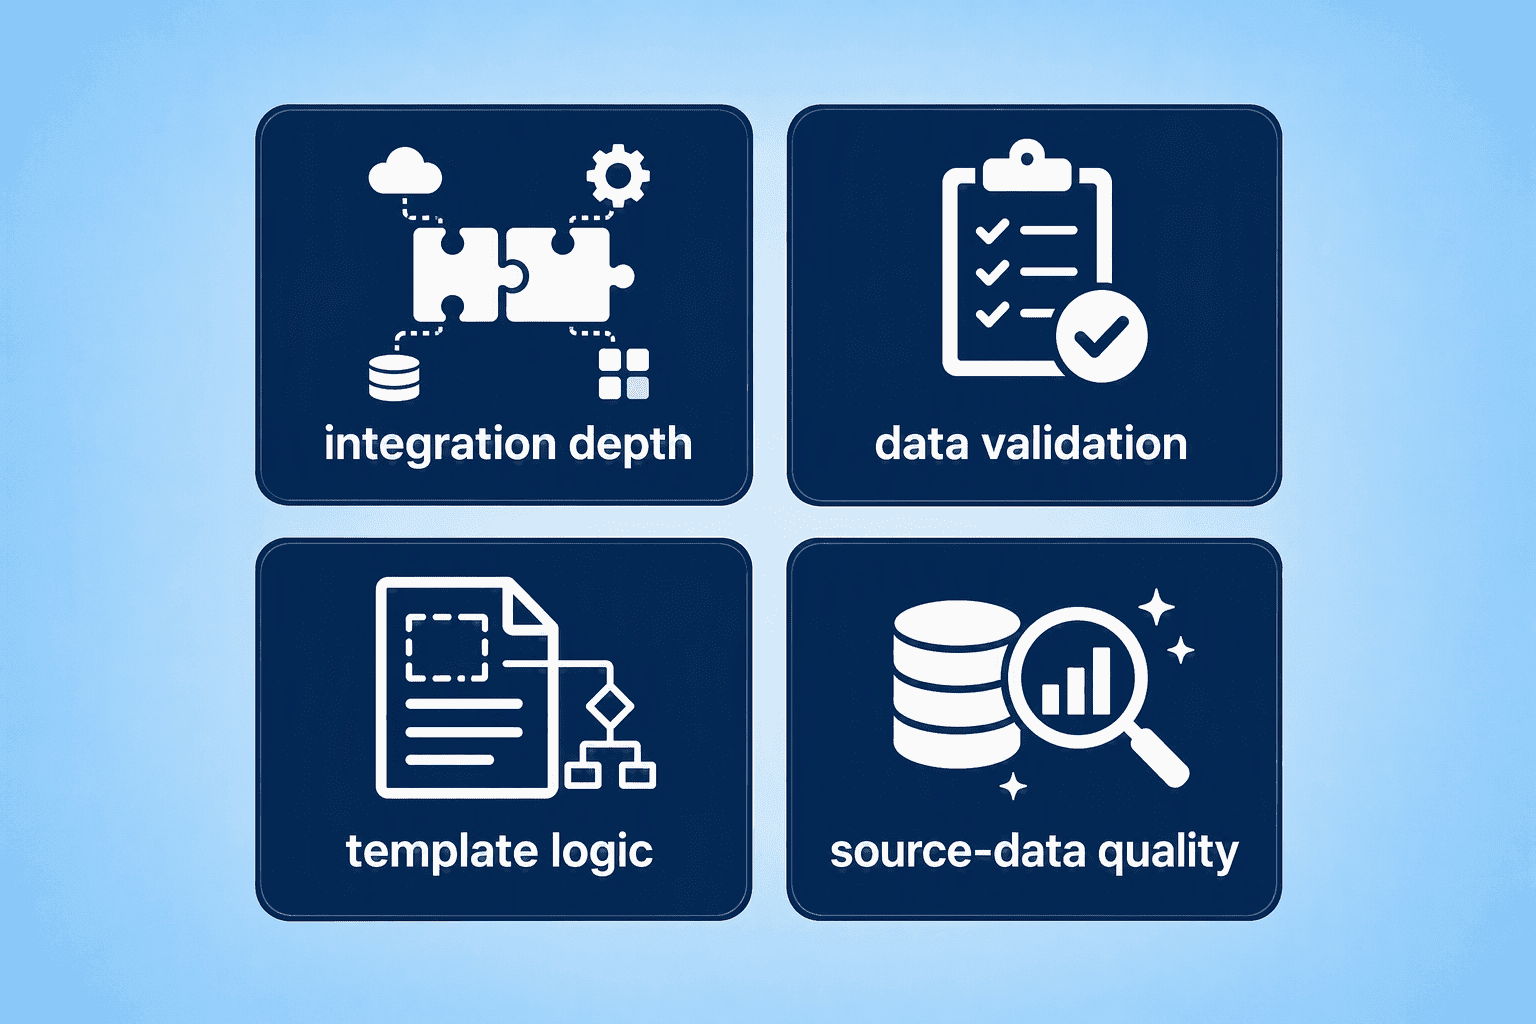
Choosing the right platform requires looking past polished demos and testing the features that determine whether implementations succeed or stall. Integration depth is the starting point. Live API connections into HRIS and payroll systems eliminate the manual reconciliation headaches inherent in CSV flat-file exports. The catch: if your source data contains errors, the software will faithfully display every mistake. Push vendors on whether the platform applies automated validation rules—CompUp embeds these into its template logic—or simply ingests whatever data you provide and passes errors through to the final output.
Data security deserves a place in evaluation criteria, not a footnote. For companies with employees across multiple countries, add GDPR compliance and cross-border data transfer safeguards to your checklist. Ask whether the vendor maintains audit trails that can support pay equity reviews or regulatory inquiries. Template logic is the final critical dimension. A statement that reads identically for a Seattle-based engineer and a London-based marketing director signals that localization has failed. Require multi-currency and multi-language capabilities along with country-specific benefit fields. Platforms that force flat content across every market will lose employee trust in locations where statutory norms and cultural expectations differ sharply from U.S. defaults.
The platforms on this list address distinct organizational challenges. Salary.com CompAnalyst excels at embedding market intelligence directly into retention conversations. CaptivateIQ delivers unmatched transparency for sales teams managing complex variable pay. HRSoft tackles enterprise equity complexity with audit-grade precision. ChartHop integrates compensation into a comprehensive people operations platform that connects pay to workforce planning. Aon Radford aligns board-level benchmarking with employee-facing communication. CompUp combines planning and statement delivery in a unified workflow.
The right choice depends on what problem creates the most friction today. If market-driven retention is your priority, platforms with deep benchmarking integration deliver the most value. If global inconsistency causes confusion, invest in tools with robust multi-currency localization and region-specific compliance. If employees ignore benefits communications, prioritize interface design and employee experience over feature depth. If planning and communication happen in silos, look for unified platforms that connect both workflows. Match the platform to your compensation philosophy and operational pain points, not to the feature list that sounds most comprehensive on a demo call. A practical next step is exploring a free demo of how CompUp approaches this in practice.
The top platforms include CompUp for integrated pay equity analysis, Salary.com CompAnalyst for market-data-driven statements, Pequity for rapid post-comp-cycle automation, and CaptivateIQ for sales team commission visibility. HRSoft, Compport, Benify, and Aon Radford cover enterprise equity modeling, global localization, employee experience, and benchmarking-specific needs respectively.
CompUp unifies compensation planning and total rewards delivery in a single interface. Its integrated pay equity dashboards flag internal gaps before statements go live, while automated data validation, pre-built templates, and real-time benchmarking reduce manual reconciliation work and enable proactive correction rather than retrospective explanation.
Multinational employers must additionally address GDPR and cross-border data transfer rules. Most jurisdictions do not legally require total rewards statements, but the data they contain is sensitive and regulated.
Employees who understand the full value of their total compensation are more likely to stay. Market-contextualized statements from platforms like CompAnalyst convert a retrospective benefits summary into a retention tool, while pay equity dashboards let organizations correct disparities before they become visible and erode trust.
Implementation runs 2 to 8 weeks depending on data complexity and HRIS integration depth. Pricing typically ranges from $5, $15 per employee per year for basic generators, scaling to $20,000+ annually for enterprise platforms with benchmarking and equity modeling. Vendors like CompUp offer free demos to validate fit before commitment.
Community Manager (Marketing)
As a Community Manager, I’m passionate about fostering collaboration and knowledge sharing among professionals in compensation management and total rewards. I develop engaging content that simplifies complex topics, empowering others to excel and aim to drive collective growth through insight and connection.
Revolutionizing Pay Strategies: Don't Miss Our Latest Blogs on Compensation Benchmarking