

Your payroll is likely your single largest expense. In many organizations, labor costs devour as much as 70% of total business costs. That is not an expense line; it is a strategic bet you place on talent every month. Yet, for many HR and finance leaders, the process managing that investment is a reactive scramble of spreadsheets and ad-hoc approvals. A broken process here means you are leaking cash, breeding internal inequity, and missing your retention targets.
The ground is also shifting underneath you, fundamentally. India’s Labour Codes 2025 take effect on 21 November 2025, and this is not a minor compliance tweak. The Code on Wages, 2019 introduces a structural mandate: wages must constitute at least 50% of an employee’s total remuneration. This single rule rewires how you structure allowances, provident fund contributions, and overtime. Getting this wrong on a spreadsheet is no longer an option.
This is the moment to move compensation planning from an annual administrative event to a continuous, data-driven capability. This playbook moves sequentially through the architecture of a modern compensation strategy, starting with the philosophy that anchors your decisions and ending with the automated communication that drives retention.
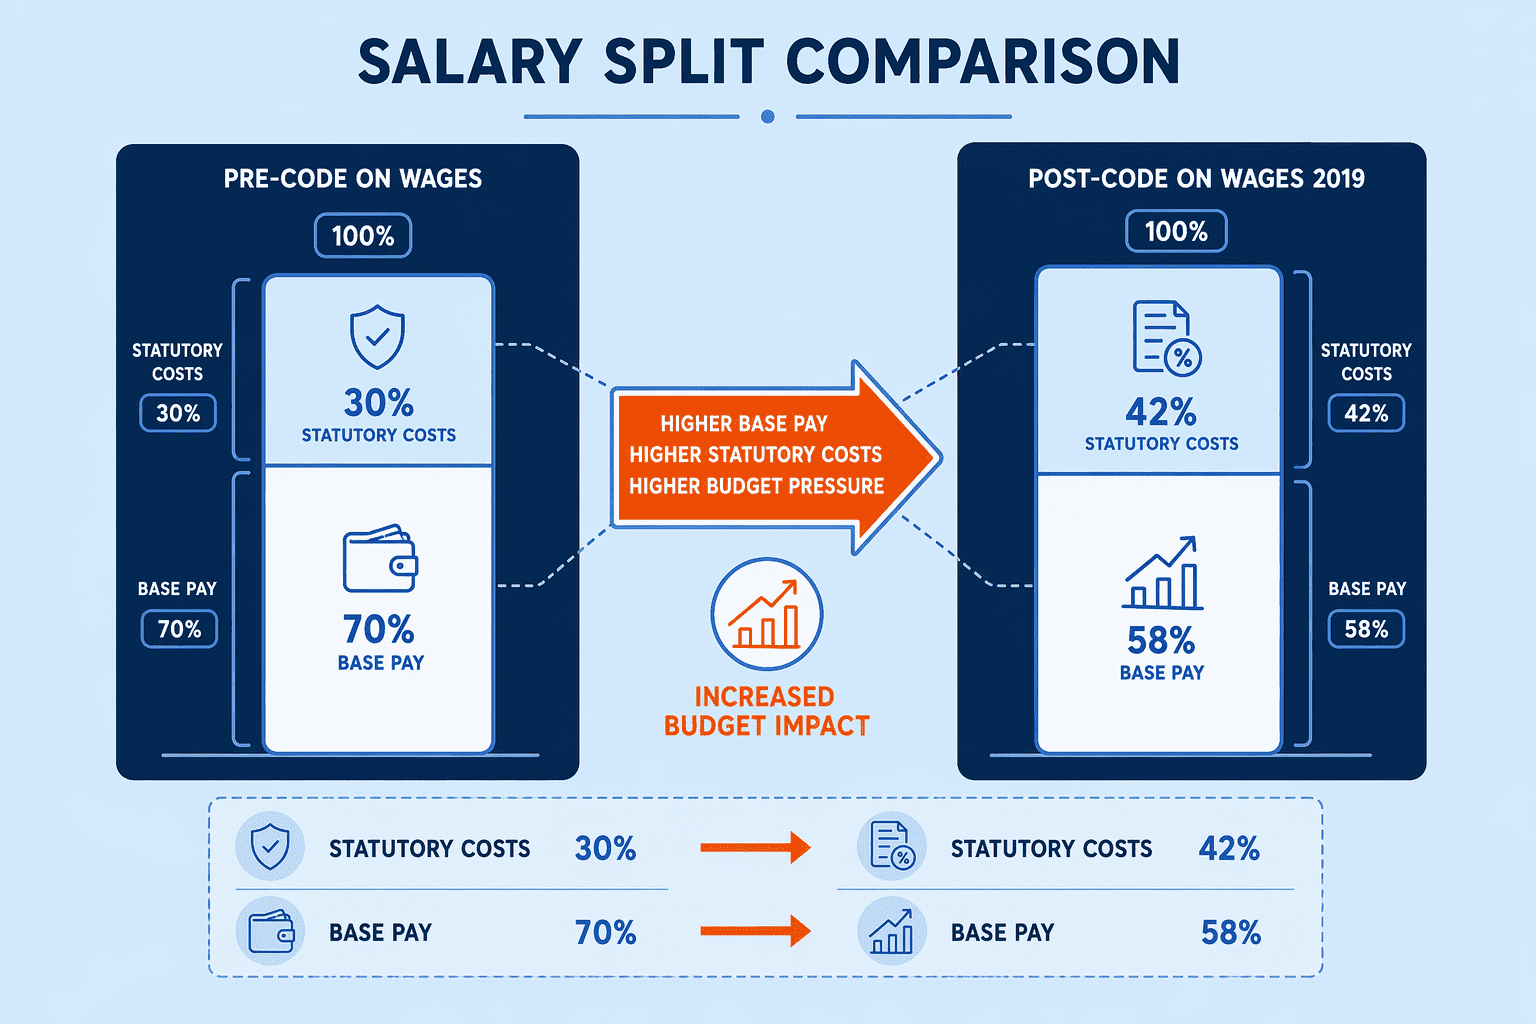
Here is how the options compare across the dimensions that matter most.
| Compensation Component | Pre-Code on Wages (Typical) | Post-Code on Wages 2019 (Required) | Impact on Budgeting |
|---|---|---|---|
| Base wages (Basic + DA + Retaining Allowance) | 30 to 40% of total CTC | At least 50% of total CTC | Forces increase in base pay, raising PF & gratuity costs |
| Allowances (HRA, special, conveyance, etc.) | 40 to 50% of total CTC | Capped at 50% of total CTC | Reduces flexibility to lower statutory contribution costs |
| Provident Fund (employer share) | Calculated on 30 to 40% base (lower cost) | Calculated on 50%+ base (higher cost) | Increases monthly outlay for PF contributions |
| Gratuity liability | Based on 30 to 40% base (lower accrual) | Based on 50%+ base (higher accrual) | Raises annual provision for gratuity on balance sheet |
| Overtime hourly rate | Variable; often calculated on gross pay | 2 × normal hourly wage (per OSH Code) | Compliance risk; budget must account for higher overtime costs |
| Total remuneration (CTC) | 100% | 100% | No change in basket size, but cost heads shift upward for statutory items |
The most significant operational threat to a compensation budget in India right now is the redefinition of wages. With the Code on Wages, 2019 becoming operational, the mandate is clear: wages, defined as Basic Pay plus Dearness Allowance plus Retaining Allowance, must equal or exceed 50% of the total cost-to-company. This forces an immediate, hard conversation about restructuring cost heads. CompUp is built for this specific friction point, offering a scenario-modelling engine that lets you drag the levers on allowances, basic pay, and statutory contributions to visualize the downstream impact instantly.
You cannot manually calculate the ripple effects across a 500-person org chart. CompUp's engine automatically applies the new wage definition to your headcount, flagging every employee where deductions now threaten to breach the mandated ceiling. It also recalculates overtime liability against the new OSH Code mandate of 2 times the normal hourly wage.
The tool is not a legal advisor; technology does not automatically make you compliant. But it turns a complex, error-prone audit into a repeatable, data-backed process. It models the gross impact on provident fund and gratuity liability before you commit the budget to the board. This shifts the conversation with finance from a vague request for a budget increase to a precise, scenario-backed cost forecast.
For organizations navigating the 12-hour, 4-day workweek provision under the OSH Code, CompUp's modelling keeps any flexible schedule anchored to the statutory wage floors. A platform like this lets you build a compensation architecture where compliance and cost optimization run as parallel outputs of a single plan.
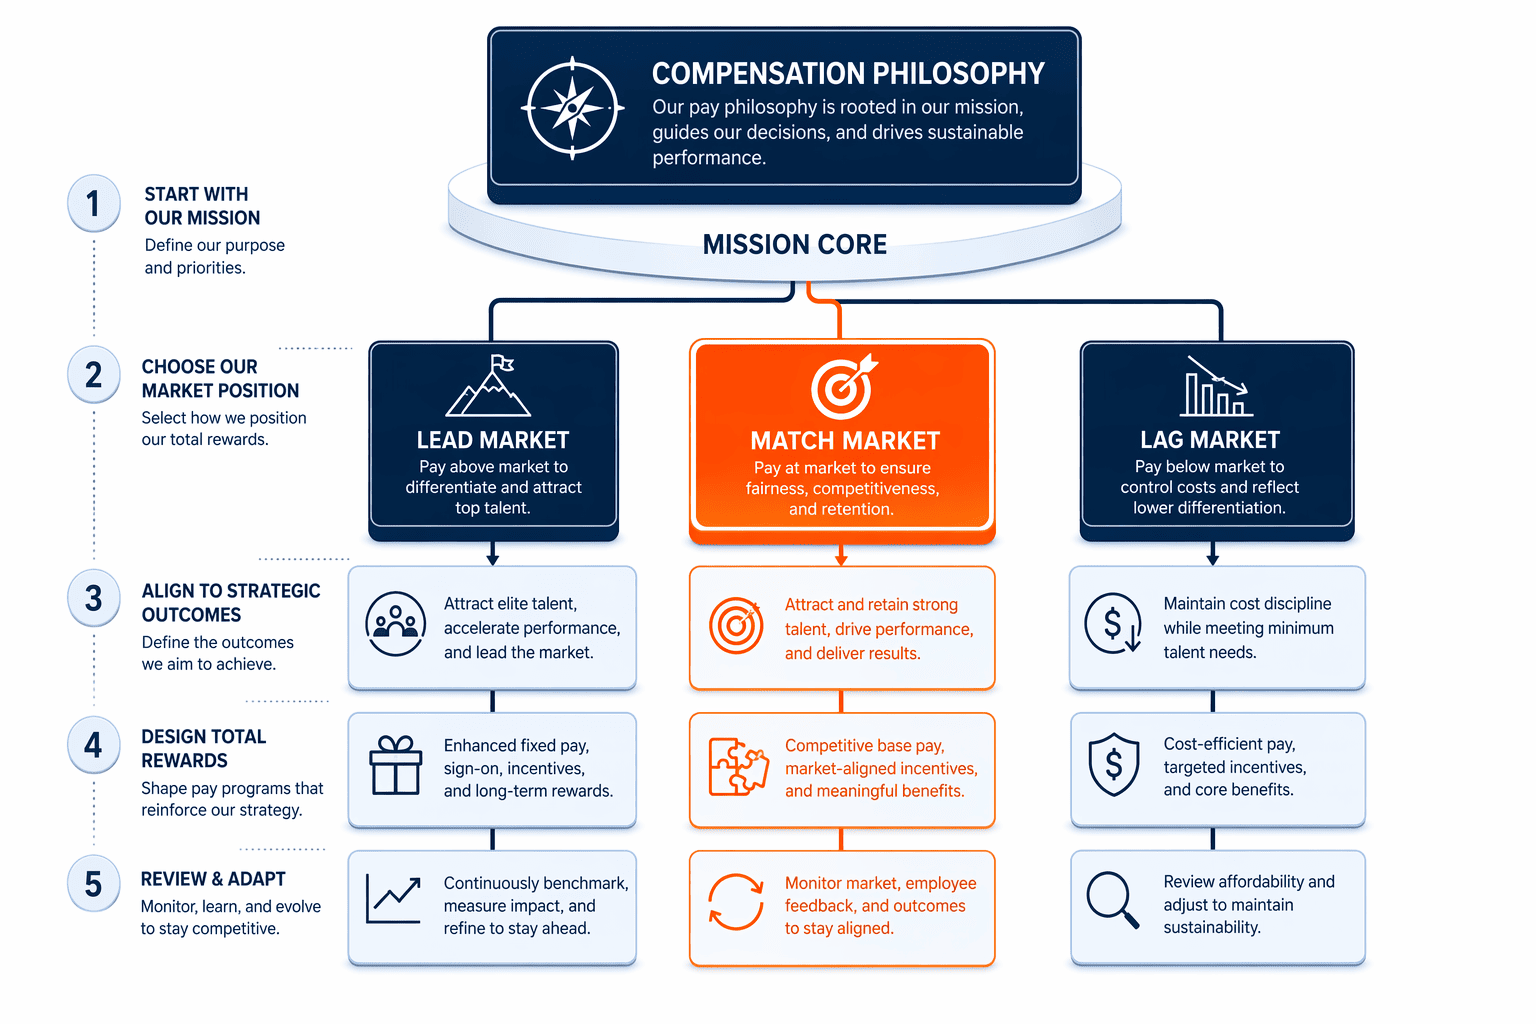
A compensation philosophy gives you a fixed grid for making pay calls, so you stop reacting to whoever shouts loudest for a raise. Here is the sequence that keeps pay tied to the mission instead of to hallway promises.
Effective benchmarking hinges on matching the right data to the right roles. The dimensions below define a modern benchmarking operation and the tools that support it.
Compensation benchmarking compares your internal pay data against external market data for similar positions. You need current, role-specific numbers, not last year's survey averages. A tool like CompUp pulls live data so your ranges reflect what competitors are paying this quarter, not what they paid in a survey fielded 18 months ago.
Market data decays quickly. Salary surveys that report once a year lose relevance as hiring cycles accelerate. Real-time data lets you adjust bands before you lose a candidate to a counteroffer. When a competitor raises starting pay for software engineers in a specific city, your next offer letter can already account for the shift.
The other half of benchmarking is internal equity. You match the external number, but you also compare it against what you pay current employees in the same role and band. If the external benchmark jumps 8% and your internal midpoint sits 12% behind, you can't fix that solely by adjusting new-hire offers. The tools you use need to flag that gap the moment it opens, not during the annual compensation review.

An annual audit finds problems a year too late. By the time a static review spots an inequitable pay gap, the affected employee is often already in a competitor's interview pipeline, driven there by a slow-burning sense of unfairness. Continuous pay equity analysis embeds a fairness check into every compensation cycle, not just the year-end review.
This requires you to build a normalized data model that groups employees by job architecture and controlled demographics. A tool like CompUp, for instance, provides a dedicated Pay Equity feature that surfaces unexplained pay gaps instantly, rather than relying on a consultant's annual report. It cross-references gender, tenure, role level, and performance rating to separate justifiable pay differences from problematic ones.
You must then execute a root-cause analysis on flagged gaps. A disparity for a single individual might be a one-time hiring negotiation anomaly; a systemic gap across a demographic cohort points to a broken promotion or starting-salary policy. Fix the policy, not just the individual salary, or the gap reopens in the next cycle.
Transparency is the final step. You do not need to broadcast individual salaries to build trust. Communicating that an automated, continuous audit process runs quarterly, identifies gaps, and allocates a corrective budget signals that fairness is engineered into the operation, not just a slogan.
A salary band is a cost-control mechanism, not an HR document. When you define a minimum and maximum salary for a role, anchored to a midpoint from your benchmarking data, you set a hard boundary on what that job can cost your business. This is your single most effective tool against grade inflation and the creeping labour costs that emerge when managers hire urgently. You contain costs not by capping ambition, but by defining a clear market range and demanding that any offer above the midpoint carry a documented justification of premium skills.
Designing these bands now carries a regulatory edge. Under the new wage code in India, the floor of your band must structurally accommodate the requirement that wages, defined as Basic + DA + Retaining Allowance, are 50% of total remuneration. This means you can no longer bury pay in flexible allowances to make an offer look competitive while keeping statutory contributions low. Your lowest band must pass a compliance test, not just a market test.
The width of a band communicates your career path. A range of 30% to 50% between the minimum and maximum gives you enough room to reward progression without a promotion. When you pair the band with an integrated platform that manages compensation bands, an employee can see the remaining earning potential in their current job grade. This clarity directly neutralizes the retention risk that comes with an opaque pay system.
Job architecture ties it together. You assign distinct value to distinct roles, stacking bands logically so an entry-level analyst is never overlapping with a seasoned manager. This internal relativity is your equity check; if it breaks, your benchmarking data is useless, because you will be paying the right amount in a broken system.

An annual budget commits the company to a set of numbers. A compensation budget works harder when you treat it as a set of live, testable assumptions. Multi-variable scenario modelling lets you adjust headcount growth, merit increase percentages, and an inflation factor simultaneously and watch the cost projection curve shift in real time.
This turns the budget meeting from a negotiation based on feel into a review of data. Model a scenario where you promote your top 5% of performers against a flat revenue quarter and you know whether the numbers add up before anyone asks for approval. That is the kind of financial visibility that earns the compensation team a planning seat, not just a cost-center label.
When your compensation system doesn't talk to your HRIS, you pay for it twice: once in the hours HR spends moving spreadsheets, and again in the errors that slip through. A synced stack keeps every salary decision grounded in the same set of facts.

An employee who views their compensation as a simple monthly deposit drastically undervalues their employer. The delta between what you spend on an employee and what they perceive you spend is a massive retention risk. Automating Total Rewards Statements closes this perception gap by itemizing the full financial weight of base pay, statutory bonuses, employer-side PF contributions, insurance premiums, and the amortized value of equity or retention bonuses in a single, personalized document.
This is a precision instrument, not a mass email. A platform like CompUp generates these statements automatically at the close of an appraisal cycle, pulling personalized data directly from the compensation model you just finalized.
Communicating pay raise decisions transparently through this lens reframes a 10% salary hike. A raise communicated as a standalone number is easily dismissed as a cost-of-living adjustment. A Total Rewards Statement presents that same raise alongside a stable suite of escalating benefits, framing the increase as a component of a growing total investment in the individual. This context is critical for countering offers from competitors who may offer a higher top-line salary but a weaker long-term structure.
This level of radical transparency is a direct retention strategy. When the calculation methodology is visible and automated, trust shifts from the manager's word to the verifiable system. This transforms the annual compensation conversation from a defensive challenge about why a number is not higher into a forward-looking discussion about the employee's full economic partnership with the firm.
Compensation planning is becoming a discipline you run year-round, not a spreadsheet fire drill you survive once a year. It shifts from a backward-looking accounting exercise into something that actively shapes how your people experience the company.
Start with a real philosophy instead of a copied salary band. Build your process so the 50% wage rule is baked in from day one, not discovered during an audit. Then make sure every employee actually sees the full number you're spending on them, not just the take-home pay.
When that's working, compensation stops being a cost center. It becomes the clearest signal of who you value and why. The teams that get this right stop losing strong performers to a competitor's offer that looked bigger mostly because it was better explained. A good next step is seeing how CompUp puts this into practice.
The compensation planning process follows three sequential steps.
Benchmarking sources live market data to set salary range midpoints for specific roles. Pay equity analysis then cross-references this structure against internal employee data by gender, race, and tenure. Used together, they ensure roles are priced competitively externally and paid equitably internally, eliminating both attrition risk and discrimination.
Compensation bands set hard, role-specific minimum and maximum pay limits that prevent grade inflation and cap hiring costs. Scenario modelling allows you to stress-test these bands against variable inputs like merit increases or headcount growth against projected revenue, ensuring the budget remains financially sound under different economic conditions.
The new wage code mandates that base wages be at least 50% of total remuneration, forcing a transparent, compliant allowance structure. Total rewards communication complements this by itemizing the employer’s full investment. The combination ensures legal compliance while simultaneously proving the comprehensive value of the compensation package to the employee.
Organizations should build bi-directional API integrations to achieve three key outcomes.
Community Manager (Marketing)
As a Community Manager, I’m passionate about fostering collaboration and knowledge sharing among professionals in compensation management and total rewards. I develop engaging content that simplifies complex topics, empowering others to excel and aim to drive collective growth through insight and connection.
Revolutionizing Pay Strategies: Don't Miss Our Latest Blogs on Compensation Benchmarking