
Your quarterly board deck shows headcount aligned with revenue, yet a critical launch stalls because the one specialist you needed was never in the pipeline. That gap is a failure of workforce planning, not recruitment. By 2027, 31% of U.S. employers expect headcount growth, per The Conference Board.
Traditional headcount budgeting cannot keep pace. It accounts for salaries finance will fund, but misses skills, attrition, and the AI agents now joining teams as digital workers. This article walks through a six-step process that integrates real-time compensation data and modern talent sourcing so you can build a workforce plan that delivers the right people, at the right cost, exactly when you need them.
What follows is a scannable summary of the core numbers, steps, and shifts that make the 2027 workforce planning playbook different.
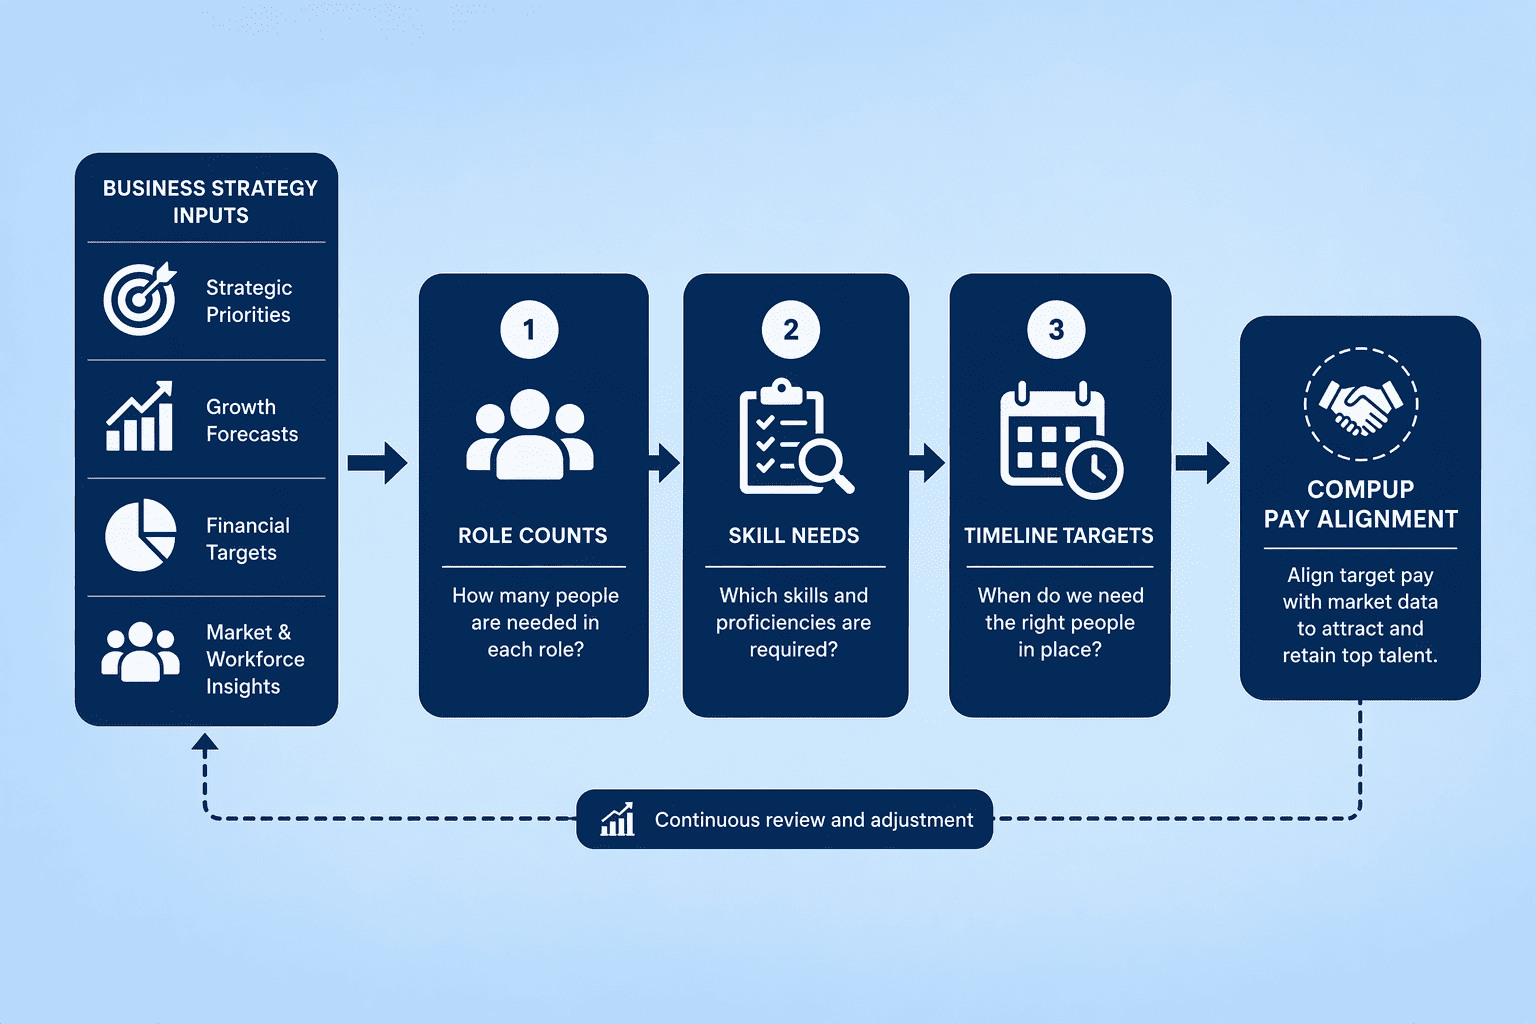
Demand starts with strategy, not spreadsheeted headcount. Your 2027 revenue targets, product launches, or geographic expansions determine which roles and skills you need, and when. For example, a tech firm planning to ship an AI module by Q3 may need five machine-learning engineers by Q1. Translate goals into role counts, required capabilities, and a timeline. The Department of Commerce's framework instructs planners to first establish a strong planning foundation by validating mission objectives and assessing current workforce conditions.
That translation gets harder when compensation markets shift. Base salary growth is slowing: only 3.9% in 2026, down sharply. If you price new roles using stale benchmarks, your forecast is fiction.
Here, a tool like CompUp can inject real-time, industry-specific compensation data directly into the demand model. Its benchmarking database lets you attach compliant salary ranges to each future role so your forecast reflects the market you will actually recruit in. You are attaching cost anchors that make the demand forecast actionable for finance.
Plan for volatility. Best practice is scenario-based forecasting: model low, medium, and high demand projections. The Department of Commerce guide explicitly recommends using scenario-based planning. If the sales pipeline jumps 20%, your medium scenario flips to high, and you can immediately see the talent and budget consequences. Without that, you are flying blind in a year when headcount intentions are rising but salary inflation is cooling, a combination that creates sharp trade-offs.
Automate the obvious. By the time you are at this stage, any tool that can connect business metrics to role counts saves hours. CompUp, for example, starts at $3 per employee per year and can pull in org-wide financial data to auto-generate headcount scenarios by department. That speed lets you spend time on the strategic judgments a model alone cannot make.
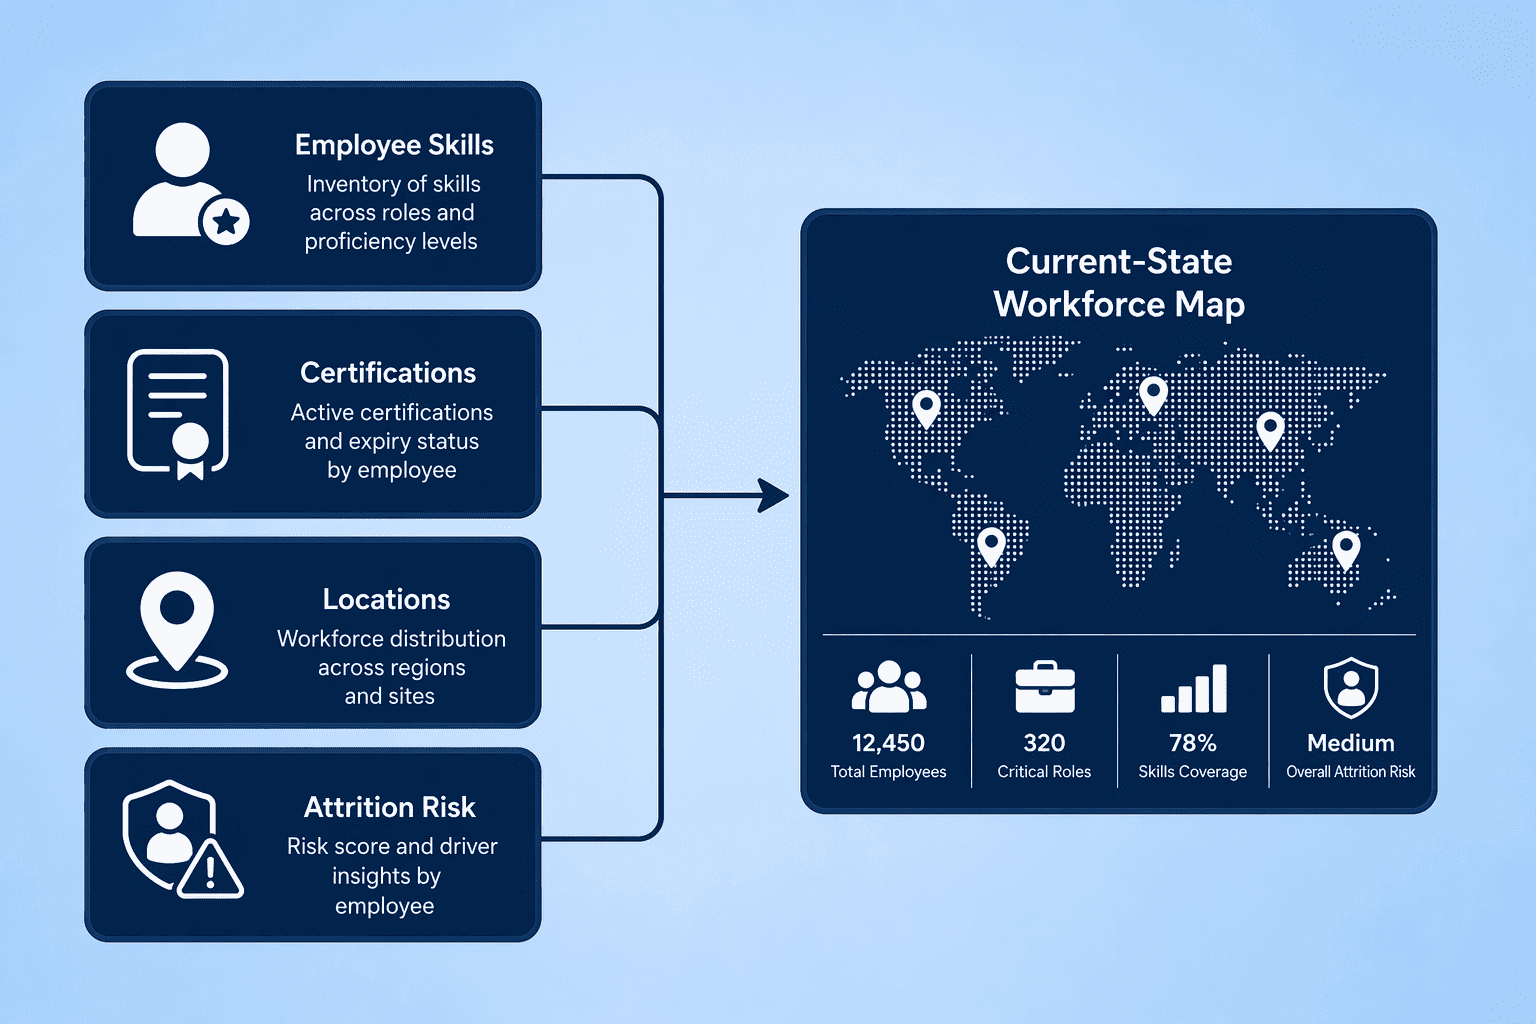
You cannot close a gap you have not measured. Start with a skills inventory that goes beyond job titles: map competencies, performance levels, location, and demographics. The CIPD frames workforce planning as balancing labour supply (skills) against demand (numbers needed). If your CRM rollout needs five certified Salesforce admins and you have two, the supply side already shows a deficit of ready capacity. Capture certifications, past project experience, and language proficiency, the inventory needs specifics.
The Oklahoma workforce planning model advises comparing the future state with the current state to pinpoint the workforce gap. A static headcount audit is dangerous because attrition is never zero. Turnover leaks talent you were counting on.
Integrate historical attrition rates by role, tenure, and performance band, then layer on predictive models for at-risk populations. IBM's workforce planning tools now use AI to forecast workforce needs, flagging flight-risk patterns that a spreadsheet misses.
Data analytics moves the audit from a backward-looking census into a forward-looking risk assessment. For instance, if your high-performer turnover spikes at the two-year mark, your supply model bakes in a replenishment buffer.
Real-time analytics turns the audit from a one-off project into a continuous pulse. Systems like CompUp surface live attrition trends and internal mobility rates. When a senior engineer hands in notice, the supply model updates immediately, and the downstream gap analysis recalibrates.
Don't overlook internal mobility. Even with attrition, you may have latent supply in adjacent teams. Skills adjacency mapping identifies employees who could cross-train in under six months.
One healthcare organization found it could cover 40% of its predicted nursing gap through upskilling medical assistants, a win that a job-title-only audit would have missed. The supply audit gives you a crisp number: the difference between your audited supply and forecasted demand, a deficit of three senior developers, a surplus of two project managers. It is the data that makes the workforce plan real.
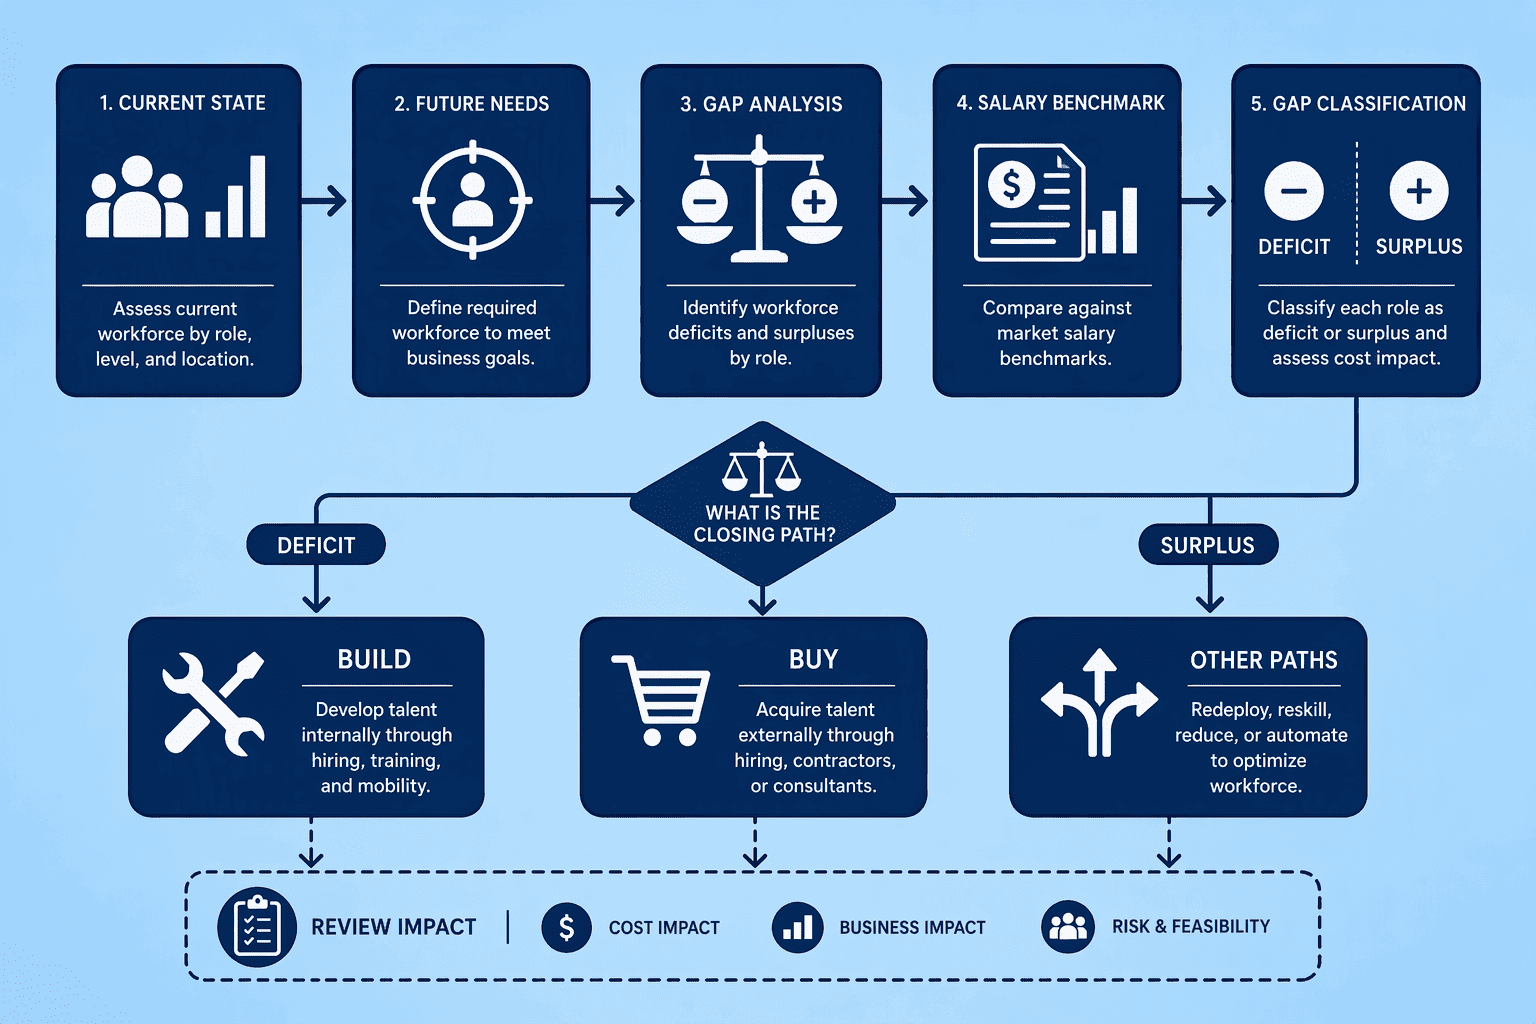
Gap analysis isolates the difference between your audited supply and forecasted demand: deficit of three senior developers, surplus of two junior analysts, and a looming retirement cliff in quality assurance. The CIPD defines this as the gap between the present and the future. Quantify it in role counts, skill depth, and timeline.
Once the gap is sized, cost each closing path. A build approach, training existing staff, carries direct training costs and the opportunity cost of ramped productivity. A buy approach, external hiring, incurs recruitment fees, sign-on bonuses, and the total comp outlay informed by accurate salary benchmarks.
With salary increase budgets projected at 3.5%, competitive offers demand precise market data. CompUp’s real-time benchmark database lets you model the total comp cost of a new hire versus an internal reskill, so the decision is grounded in local pay reality, not outdated surveys. This turns a philosophical build-or-buy debate into a line-item comparison that finance can sign off on.
Do not forget friction costs. A hired developer takes three to six months to reach full productivity; an internally trained one may already know your systems. Weight those curves. If the gap is urgent (a Q2 launch), buy may win despite higher sticker cost.
The gap analysis output is a costed, timeline-sensitive menu that lets you choose where to build, buy, or borrow. Some gaps are more expensive to ignore than to fill. Start there.
Modern workforce planning adds a fourth option: bot. A one-sentence comparison:
| Strategy | Definition | Best For | Cost Profile | Example | Risk |
|---|---|---|---|---|---|
| Build | Upskill or reskill existing employees into target roles. | Skills-adjacent roles; cultural fit. | Lower cash outlay; higher time. | Training medical assistants into nurses; internal data bootcamps. | Delayed productivity; flight risk after investment. |
| Buy | External hire: recruit and onboard new permanent staff. | Urgent, niche roles; new capabilities like AI engineering. | Upfront fees, market comp; faster output (ramp-up time). | Hiring a senior ML engineer with a competitive 90th-percentile package; CompUp benchmarking can anchor the offer. | Cultural mismatch; high churn if comp misaligned. |
| Borrow | Engage contractors, consultants, or gig workers for fixed scopes or periods. | Spikes in demand; project-based skill bursts. | Variable; no long-term fixed cost. | Bringing in a change-management consultant for a six-month system migration. | No institutional knowledge retained; integration overhead. |
| Bot | Deploy autonomous AI agents or copilot tools that replace or augment labor. | Repetitive, rule-based work; 24/7 operations. | Tech license plus integration; can reduce headcount cost. | An AI copilot handling tier-one IT support, freeing senior engineers. | Requires responsible oversight; changes the org model. |
Tushar Makhija of TeamOhana stresses the distinction: differentiating between AI copilots (productivity tools) and autonomous AI agents (which replace labor). Karina Bernacki frames digital workers as a new line item in the budget, separate from technology spend. CompUp’s cost analytics let you model the total cost impact of either bot path alongside build, buy, and borrow. You compare head-to-head with people costs, including the ongoing license and integration overhead, and avoid undercounting the true cost of digital labour. The goal is to assemble the optimal mix for each role gap, tied back to the cost comparison Step 3 produced.
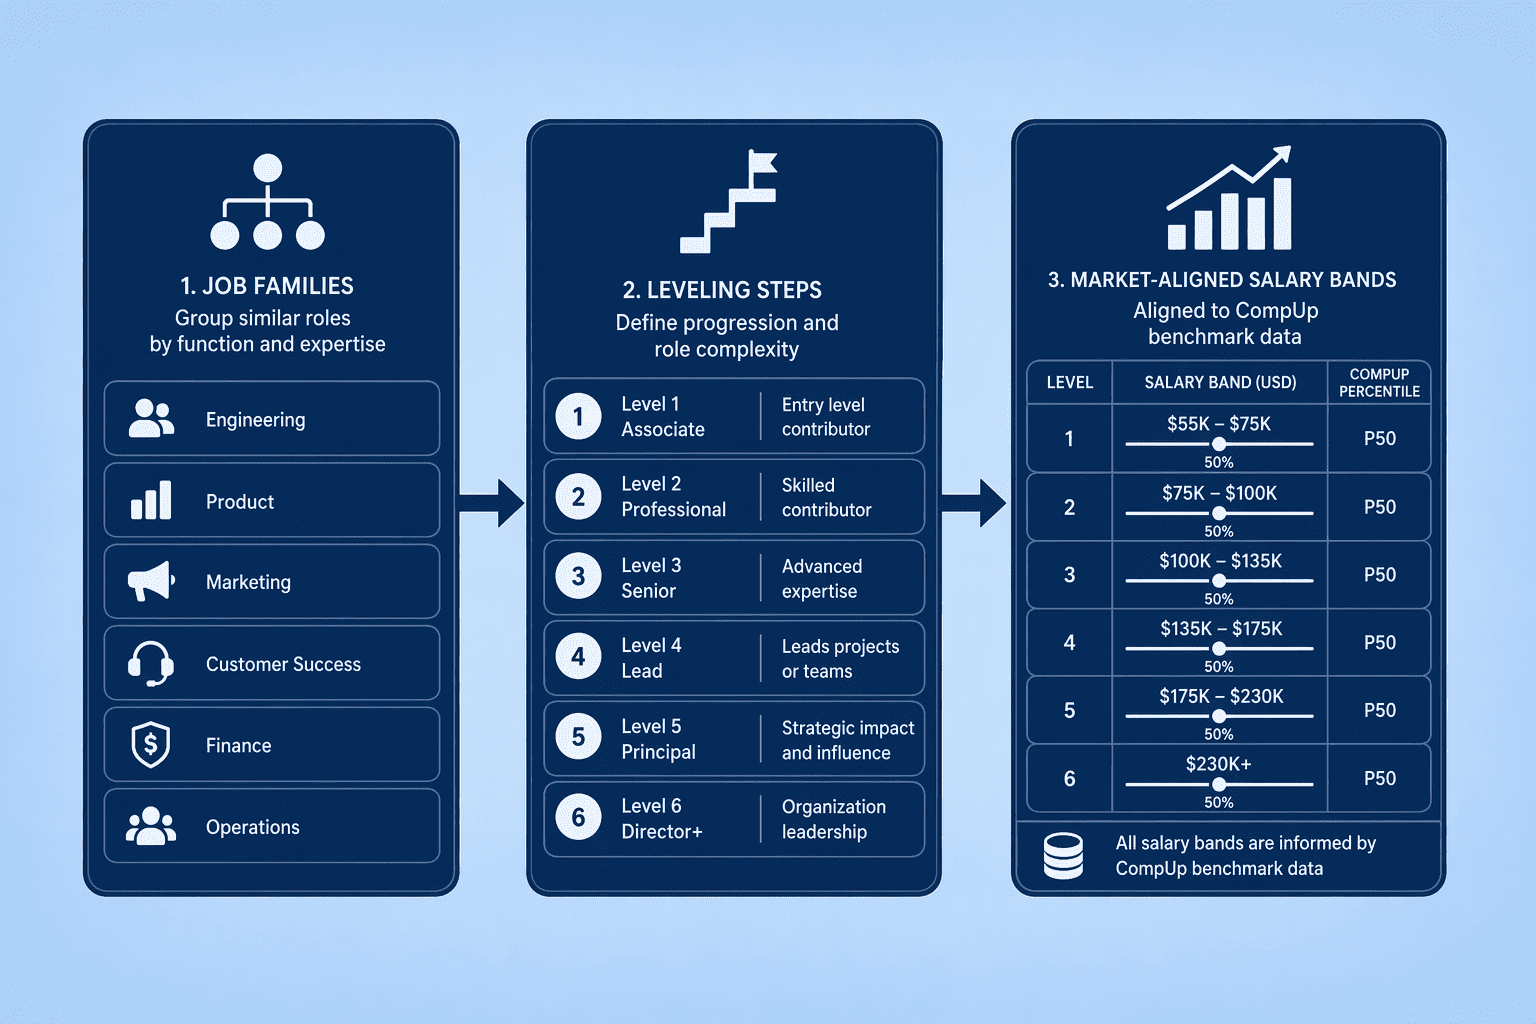
A plan on paper means nothing until pay and progression structures are built around it. Here are the implementation actions in order:
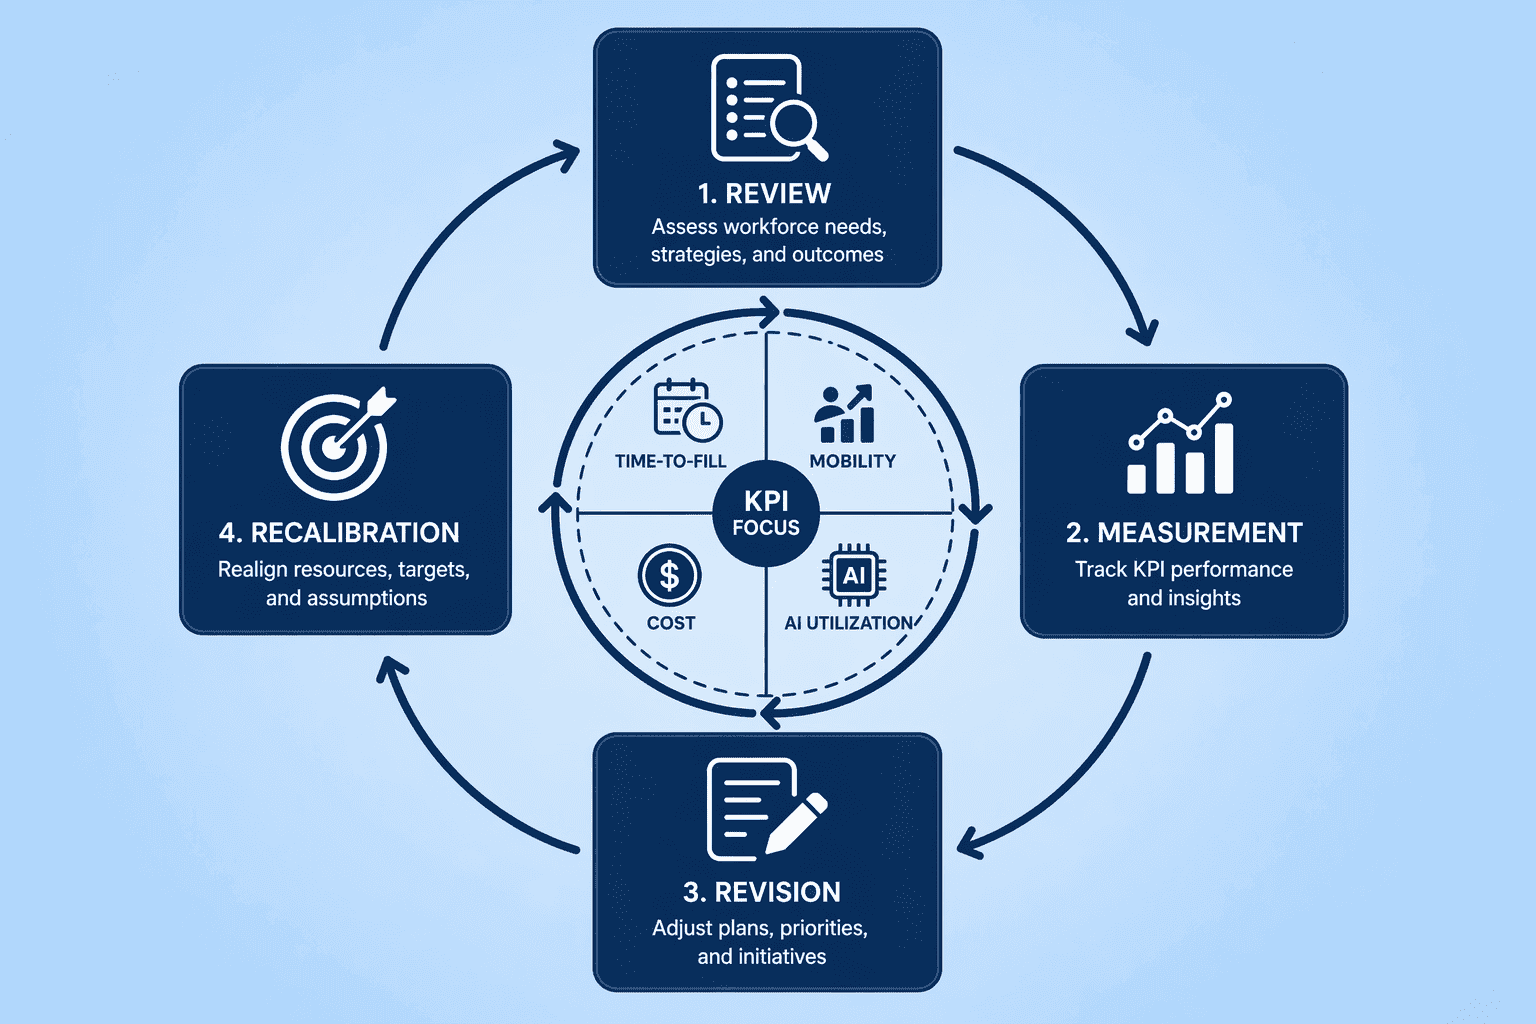
To make workforce planning a continuous, adaptive process, implement the following practices:
Workforce planning in 2027 connects strategy to execution. You account for AI agents alongside human talent and anchor every hire or build decision in real-time pay data. The six steps give you a repeatable process: forecast demand, audit supply, cost the gaps, choose your sourcing mix, implement role-based structures, and monitor the metrics that move your mission.
Static annual plans break the moment attrition spikes or a competitor poaches a critical team. A continuous, data-driven cycle, supported by tools like CompUp, keeps you ahead.
Salary growth is decelerating, headcount intentions are up, and digital workers are now a legitimate line item. Start now. A good next step is seeing how CompUp puts this into practice.
Workforce planning is a continuous strategic process of balancing labor supply (skills) against demand (numbers needed) to have the right people in the right roles at the right cost. It reduces labor costs, improves retention, and ensures business goals aren't stalled by talent shortages.
The operational workforce planning process comprises six core steps:
Headcount planning budgets for the number of salaries finance will fund. Workforce planning additionally identifies required skills, accounts for attrition, AI agents, and internal mobility, and aligns talent decisions with strategic goals using real-time market data.
Tools range from general platforms like Workday Adaptive Planning and IBM Planning Analytics to specialized compensation platforms like CompUp. The right tool depends on your size and whether finance or HR leads the process.
Key trends include integrating AI agents as a line item, shifting from annual to continuous planning cycles, tying workforce decisions to real-time salary benchmarking, and using predictive analytics for attrition and skills gaps.
Track time-to-fill critical roles, quality of hire, internal mobility rate, workforce cost as a percentage of revenue, and AI agent utilization. Limit KPIs to the most mission-relevant indicators.
Community Manager (Marketing)
As a Community Manager, I’m passionate about fostering collaboration and knowledge sharing among professionals in compensation management and total rewards. I develop engaging content that simplifies complex topics, empowering others to excel and aim to drive collective growth through insight and connection.
Revolutionizing Pay Strategies: Don't Miss Our Latest Blogs on Compensation Benchmarking