

Your finance team just received a resignation letter from a senior engineer. The replacement cost alone will hit six figures, but the bigger shock arrives when you check the market data: your salary band for that role is 15 percent below the current US software engineer median of $192,120. That gap is a structural problem, and in 2026 the legal exposure sits squarely on your desk.
State pay transparency laws in California, Colorado, New York, and Washington now require you to post a defensible salary range on every job listing before a single candidate sees it. OFCCP pay-data collection rules add another layer of federal scrutiny. The regulatory shift is immediate and irreversible. Job pricing tells you what a role is worth. Compensation bands turn that data into a governed, repeatable framework that keeps you compliant.
The move from optional talent strategy to mandatory legal requirement is already here. This guide lays out an 8-step process to price jobs with credible market data, build min-target-max bands, layer in geographic and specialty premiums, embed pay equity audits, and scale the whole system with purpose-built software. By the end, you will have a model that attracts talent and stands up to a regulator's review.
Pricing jobs and building bands is a compliance function as much as a talent one. The eight steps below move you from raw market data to a governed, automated compensation architecture.
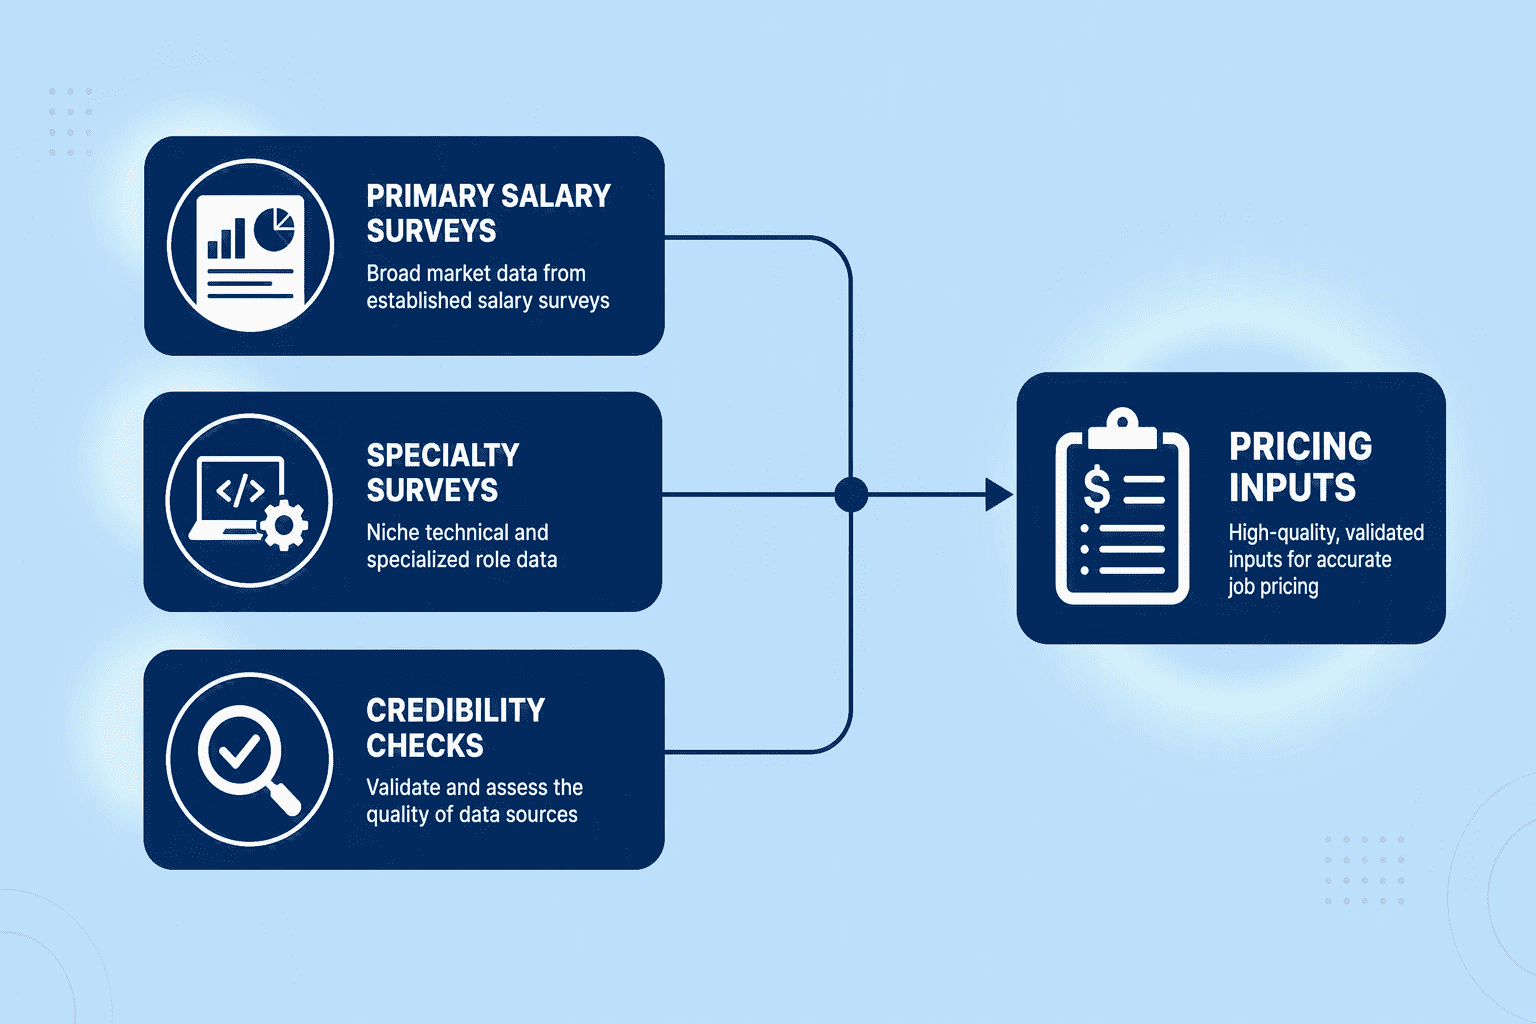
Job pricing lives or dies on the credibility of its inputs. The median US software engineer base salary sat at $192,120 in 2026, but that number is only as good as the source that produced it. Choose your data suppliers before you draft a single band.
Your pay philosophy turns cold market data into a business strategy. Decide how competitive you need to be, then define the levers you will pull to get there. The table below maps three common postures across the dimensions that matter in 2026.
| Dimension | Pay at Market (P50) | Pay Above Market (P75) | Pay Below Market (Lean) |
|---|---|---|---|
| Talent brand signal | We are fair and competitive | We buy top-quartile talent | We bet on mission, equity, and growth |
| Cash vs. equity trade-off | Base anchors; equity is a top-up | Heavy base and bonus; equity as sweetener | Cash is constrained; equity is the primary upside |
| Common life stage | Growth stage with stable funding | Late-stage private or public, high cash flow | Seed to Series A, cash conservation mode |
| Recruiting risk | Moderate; you will lose some outliers on both ends | High offer-acceptance rate; budget pressure | High candidate drop-off; requires strong equity story |
| Compliance exposure | Easily defensible with market data | Defensible if documented; attracts pay-equity scrutiny on internal parity | Risk of under-market ranges triggering disclosure-driven candidate pushback |
A philosophy statement might read: "We target the 50th percentile of our primary market surveys for base salary and build total cash at the 65th percentile through variable pay." Put it in writing. A documented philosophy is your first line of defense if a posted range is ever challenged. A platform like CompUp can link that philosophy directly to your budget assumptions so every band inherits the same logic.
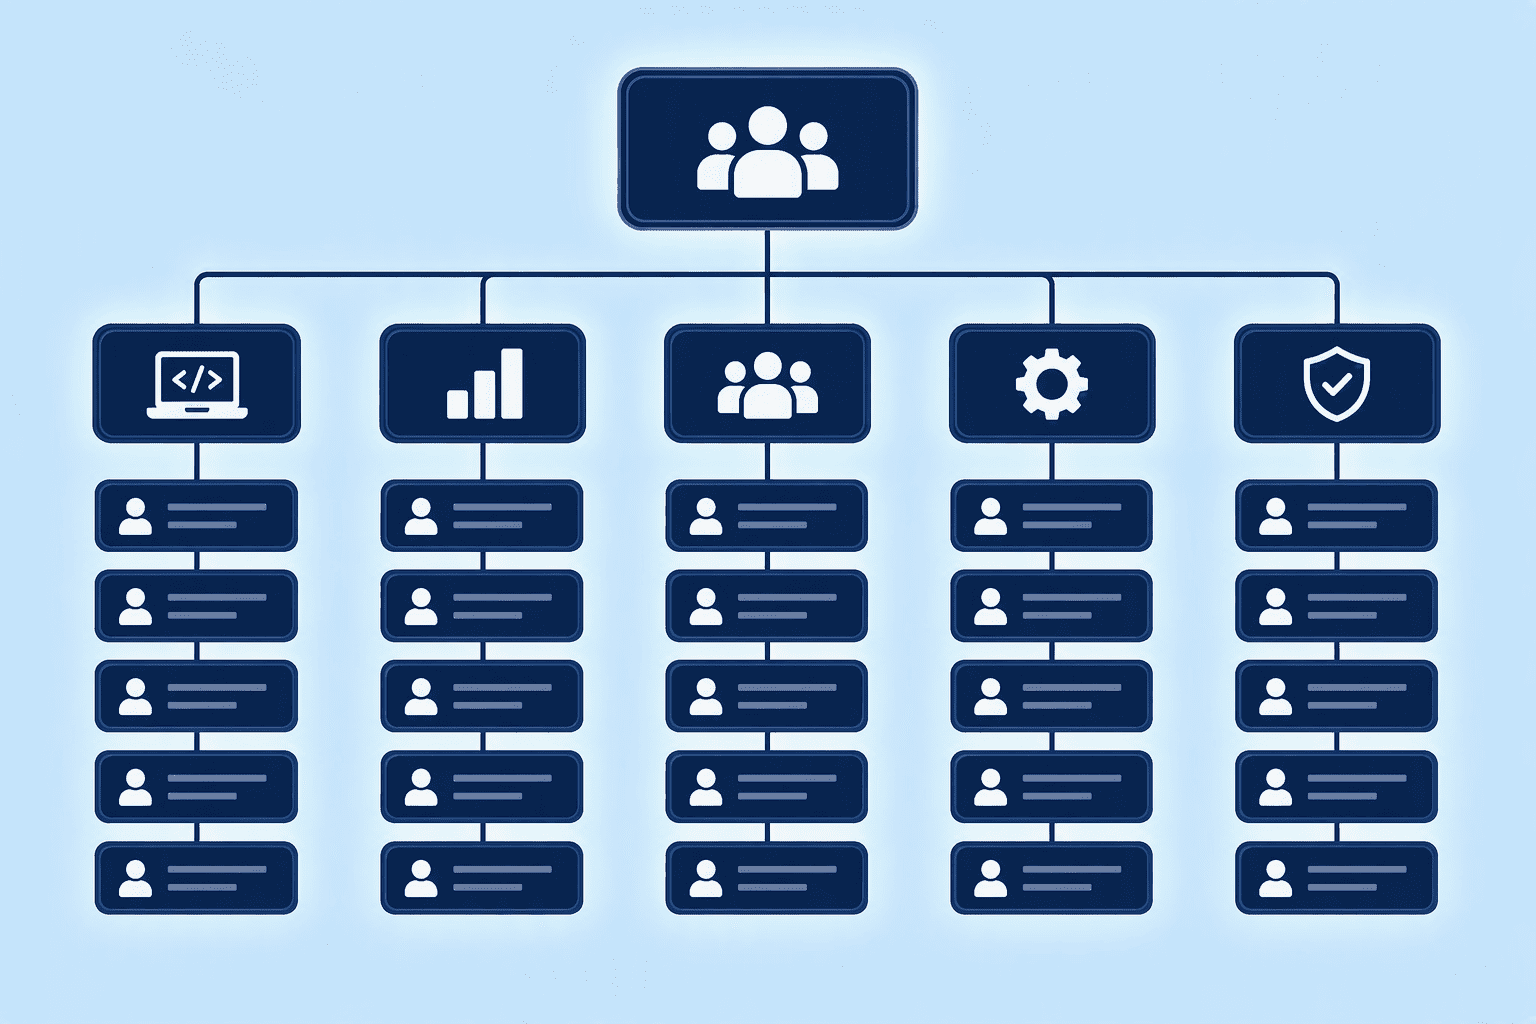
Market data gives you a price. Job architecture gives you a place to hang it. Without a leveling framework, you end up with ad hoc bands that drift across departments until two identical-scope roles sit in ranges $30,000 apart.
Start by grouping positions into job families, the highest-level grouping of similar work duties. Rice University uses 15 job families to organize its workforce. Within each family, jobs split further into subfamilies that share specific technical skills and knowledge. A good framework also defines career streams. At Rice, the Management stream requires three or more direct reports; individual-contributor tracks follow a different set of expectations.
Leveling ladders are where architecture gets teeth. Wichita State's framework defines four job groups, from Business and Administrative Support through Leadership Levels. Inside each group, levels climb by scope.
An Assistant performs standardized, ongoing duties with limited discretion. A Manager at the top of that same family makes decisions with significant impact within the department or organization. Every level maps to a concrete set of criteria around complexity, autonomy, and decision-making.
The output is a grid: each position sits at the intersection of a job family, a subfamily, a career track, and a level. That profile becomes the foundation for compensation analysis, pay equity reviews, and career path planning. Band creation is now an engineering exercise. Each profile plugs into a consistent benchmark; each benchmark feeds into a governed salary range. When a manager asks to price a new machine-learning role, you classify it against the architecture, pull the relevant market data, and read off the band.
The most common mistake at this stage is matching a job title to a survey title and calling it done. A "Data Scientist" at your company might be an IC3 doing dashboarding, while the survey benchmark aggregates PhD-level researchers building NLP models. Match duties, not labels.
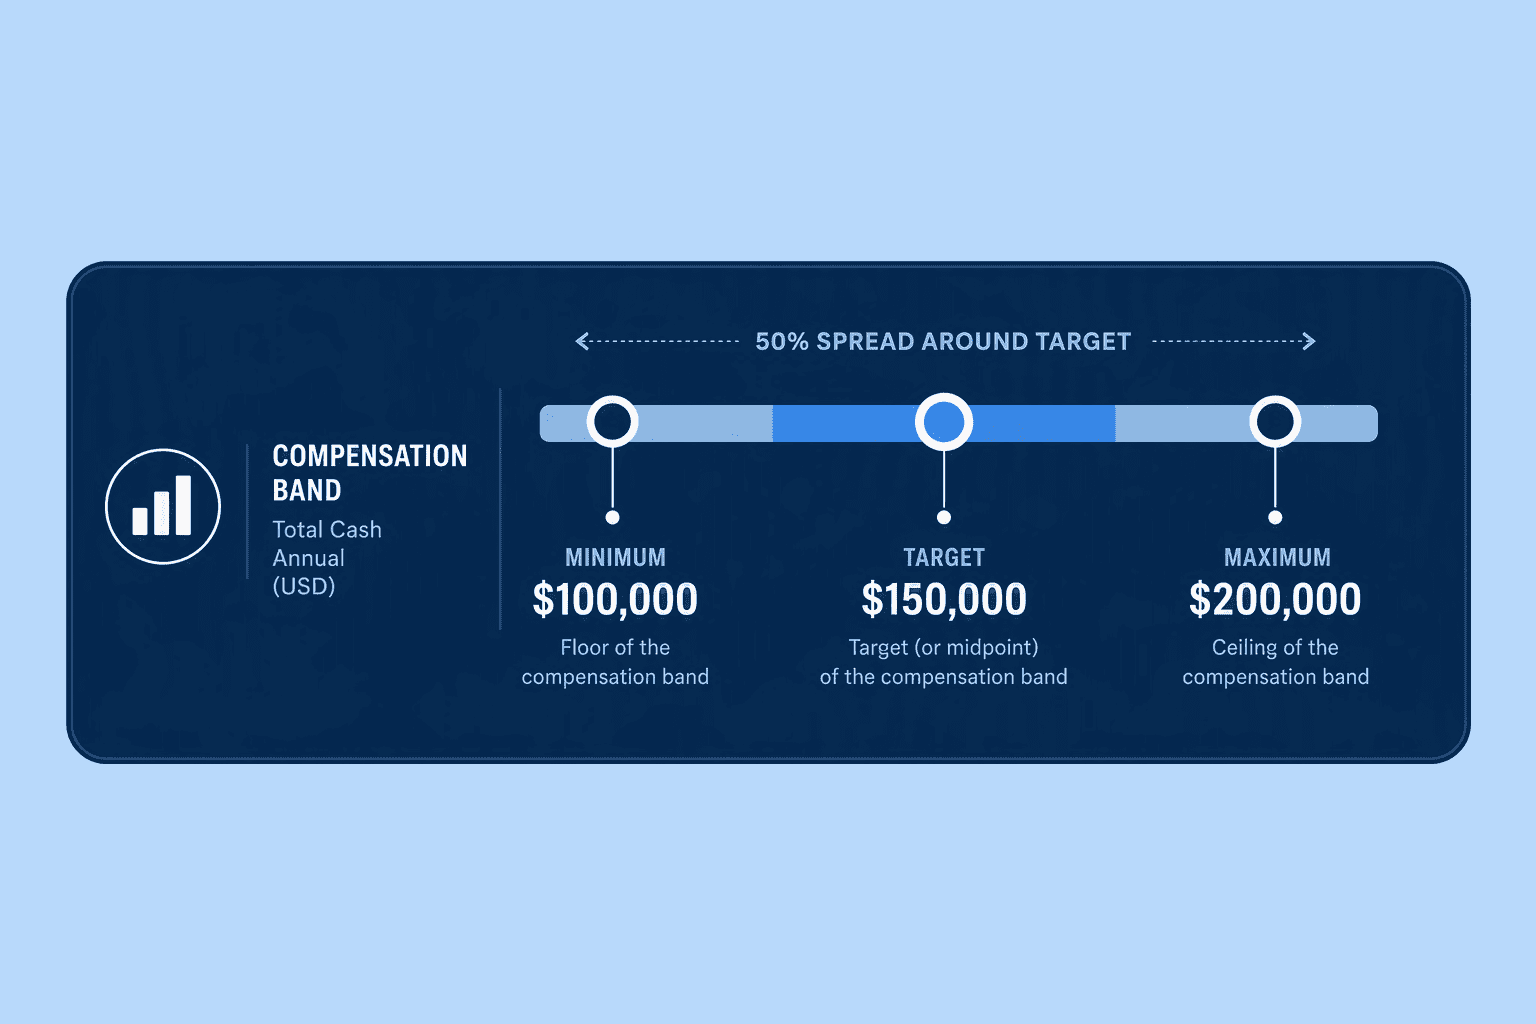
With a market anchor in hand, build the three-point structure that defines every band:
The distance between these points is your range spread.
A widely applied starting rule is a spread of roughly plus or minus 20 percent from the target. Tighter ranges, around plus or minus 15 percent, work for highly commoditized roles with narrow market variation. Broader spreads, approaching plus or minus 30 percent, give you room for long-tenure growth in a role where promotion ladders are shallow. The key is consistency: vary spread by deliberate design, not by whim.
Progression between bands needs the same rigor. When a band’s maximum touches the next level’s minimum, managers push promotions to justify pay. When the gap is too wide, you trap people. A healthy overlap sees the lower band’s maximum exceed the next band’s minimum by 5 to 10 percent. Track every employee’s compa-ratio against the target. Since November 2024 Lattice calculates compa-ratio against the target, not a mechanical midpoint, because the target is where your philosophy lives. Your bands should follow the same logic: the target is the number you actually manage to, and the minimum and maximum are its governed boundaries.
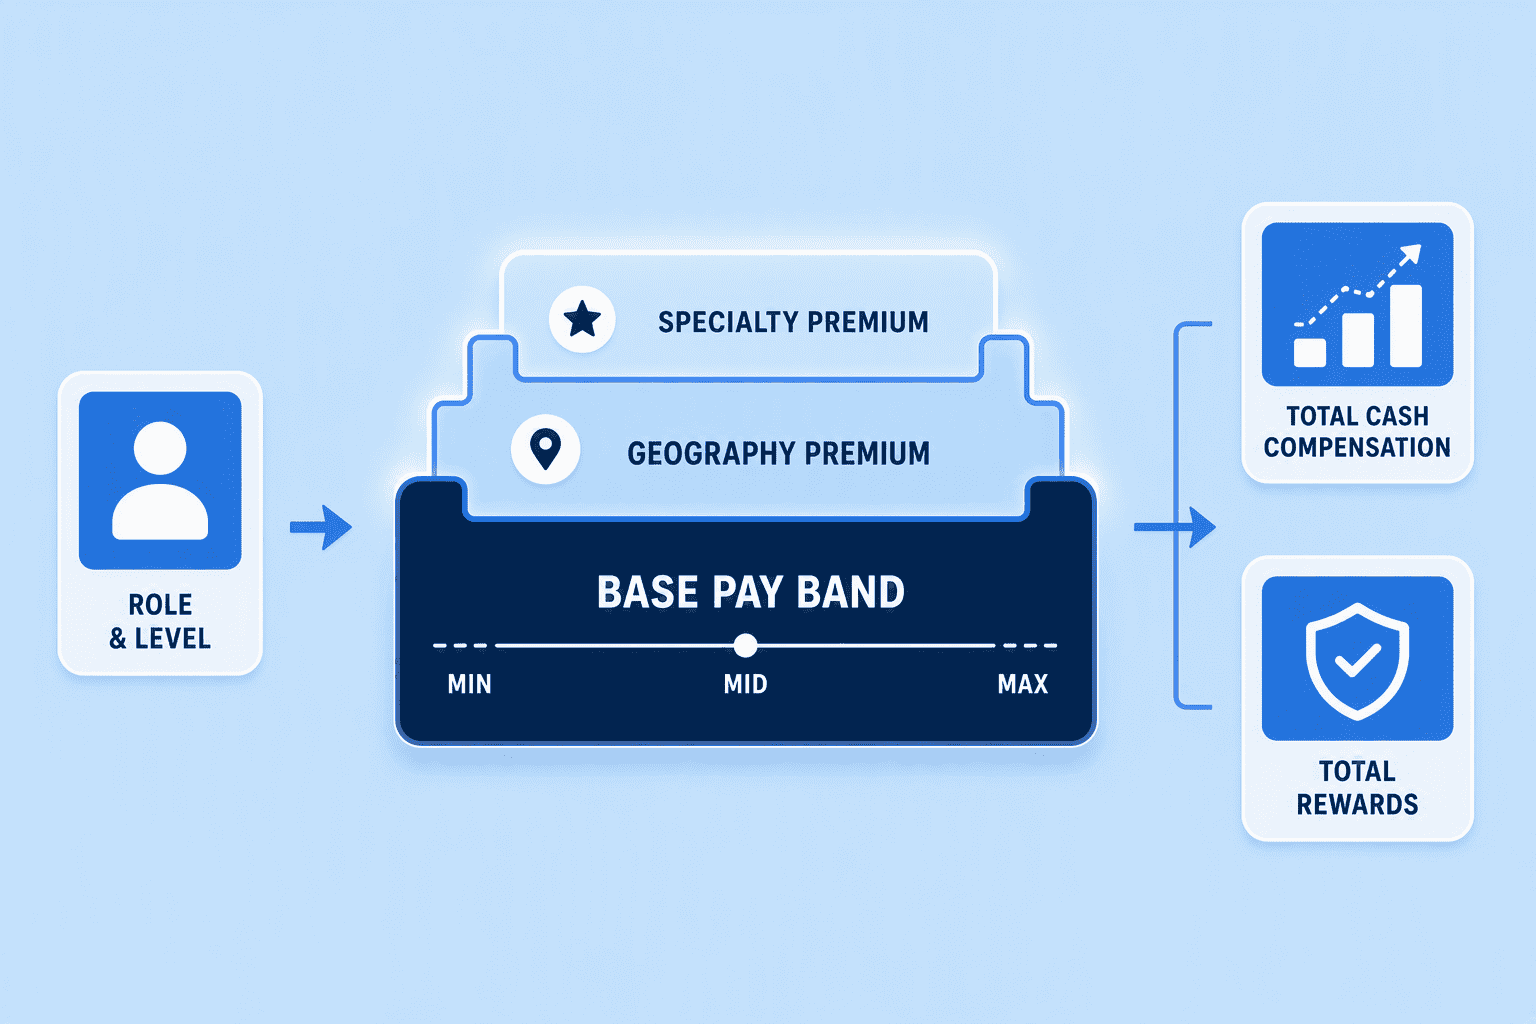
A flat national band for a role breaks the moment you hire someone in San Francisco and someone else in St. Louis. Geographic pay differentials are the most common refinement, but they must be applied as a controlled layer over the base band, not baked into it ad hoc.
Most companies define two or three pay zones. Zone 1 covers the highest-cost labor markets: SF Bay Area, New York City, Seattle. Zone 2 captures mid-tier metros like Denver, Austin, or Chicago.
Zone 3 covers everywhere else. The premium between zones typically runs 10 to 15 percent.
A given role in Austin may command nearly as much as one in San Francisco because the local talent market is that hot. Location-based pay accounts for variances in cost of living and market competitiveness, so copying a real-estate index gets you the wrong number.
Specialty premiums work the same way. AI and ML roles have carried a persistent premium over generalist software engineering bands. ISG Partners' 2026 engineering data segments these skill premiums explicitly. This keeps the band architecture clean and the premium spend targeted.
Do not forget equity. Total compensation includes stock, and bands that ignore equity break when you hire from a public company that competes on cash plus RSUs. Some companies manage equity outside the salary band entirely. Others build a total-comp band with a defined equity ratio per level. Either is defensible; the only mistake is leaving equity out of the model and then wondering why candidates walk.
A compensation band is a promise of fairness. A pay equity audit proves you kept it. Over five decades of research shows that equal-pay laws focused on identical work have failed to close the gender pay gap, because identical work is nearly impossible to measure in professional and managerial roles. The effective standard in 2026 is pay equity. You compare pay for employees doing work of comparable value under your own leveling framework.
Run an intersectional regression analysis that examines base pay by gender and race within the same job band, controlling for tenure, performance rating, and prior experience. Flag every outlier where the residual exceeds a defined threshold, usually 5 percent. A simple audit by job title and band catches the most obvious gaps. Quantitative self-audits should slice by job title, pay band, and department to surface patterns a headline number hides.
When you find a gap, remediate by adjusting the individual's base salary to the band's target or to the peer-group median, whichever is higher. Do not freeze underpaid peers while you fix one person; that creates a reverse inequity. Document the statistical model, the outliers identified, the remediation taken, and the date. With OFCCP pay-data collection requirements active and state laws in California, Colorado, New York, and Washington requiring posted ranges, a dated, documented audit is your safe harbor.
Schedule audits quarterly or at minimum per compensation cycle. Each cycle, pull the same analysis, compare it to the prior cycle's baseline, and certify whether the gap is shrinking. Regulators and plaintiffs' attorneys look for sustained indifference. An unbroken sequence of documented audits with shrinking residual gaps tells a story of active governance; a single stale report tells the opposite story. Make the audit a permanent checkpoint in your compensation calendar, right alongside the merit cycle.
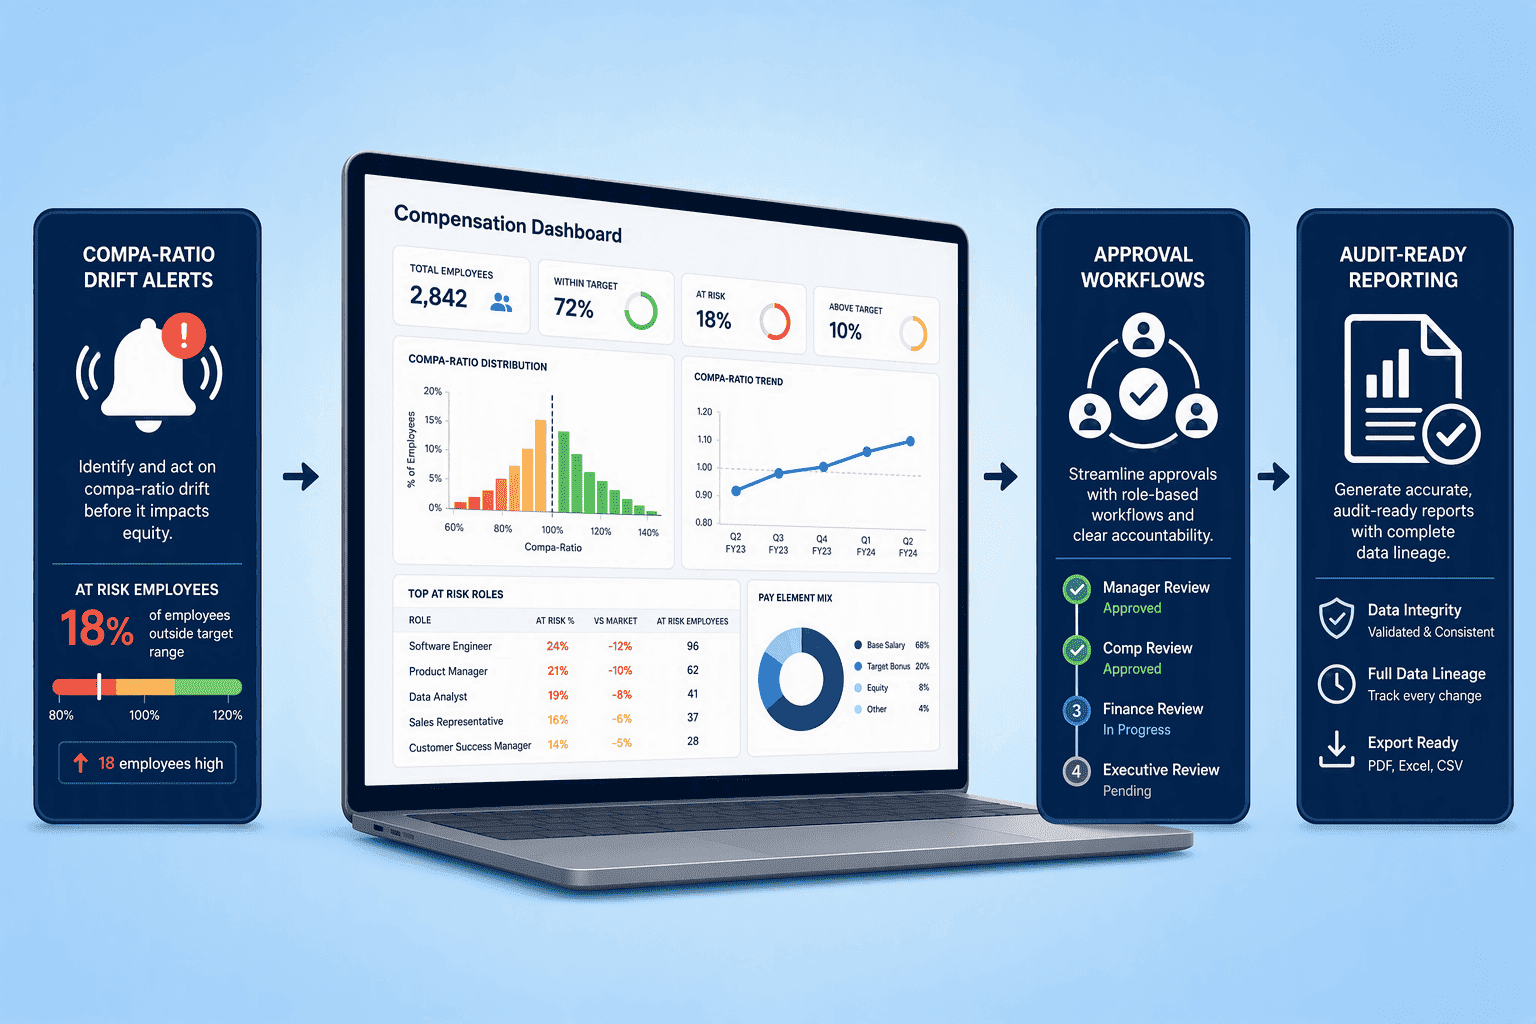
You can build bands in a spreadsheet. You cannot govern them at scale in one.
Spreadsheets do not flag compa-ratio drift across 400 employees, push a manager’s off-cycle raise through a compliance workflow, or generate an audit-ready pay equity report with three clicks. Compensation management software puts employee data, both monetary and non-monetary, into one centralized system that powers real-time analytics, merit-cycle workflows, and pay-equity dashboards.
Purpose-built tools have pulled ahead of the spreadsheet-and-email model. Lattice lets you create bands with a minimum, a target, and a maximum, assigning salary employees annual rate bands and hourly employees hourly rate bands, and calculates compa-ratio directly against the target you set. Pave’s market pricing module brings live benchmarking data into the band-building workflow so your anchors stay current between manual survey refreshes. Syndio specializes in intersectional pay equity analysis, embedding ongoing audit capability into the compensation cycle.
When evaluating a tool, check three things. Second, does its approval workflow create a strict, timestamped audit trail for every compensation decision?
Third, does it let you run budget simulations in real time, showing the cost of moving a cohort to target before you commit? A platform like CompUp ties centralized budget pools into the workflow and lets you run a scenario, see the immediate budget impact, and roll it back without touching a spreadsheet. The goal is durable band architecture as the company grows.
When someone asks what a posted range means, your answer is a folder of CSV files and an apologetic email. It is a governed, documented, and reproducible process that starts with a market benchmark and ends with a compliant, equitable band.
Pricing jobs and building compensation bands in 2026 is the single strongest enabler of pay transparency compliance, talent retention, and scalable growth. You need a repeatable, defensible system, and the 8-step model laid out here gives you one: credible market data anchored to the $192,120 median for US software engineers, through to automated pay equity audits inside governed compensation software.
State mandates in California, Colorado, New York, and Washington will not pause while you catch up. Build the architecture now, document every decision, and let the software carry the operational load. The bands you design today are the legal record you will rely on tomorrow. If you're weighing options, CompUp is worth a closer look.
Job pricing determines the external market value of a specific role by matching its duties to survey benchmarks. A compensation band is the internal salary range, minimum, target, and maximum, built around that price. Pricing answers what the market pays; the band governs what your organization will pay within a consistent, defensible framework.
Collect credible survey data, define your pay philosophy, build a job architecture with leveling ladders, match job duties to benchmarks, set a percentile anchor, construct a min-target-max band around that anchor, layer in geographic and skill premiums, and embed pay equity audits. The process starts at market data and ends at a governed, documented salary range.
Broad-market primary surveys from Radford and Willis Towers Watson are strong foundations. For engineering and technical roles, the ISG Partners 2026 survey provides specialty data. Generic online aggregators are directionally useful but should never be your sole data source for a defensible band.
Bands create a standardized pay structure that limits manager discretion and makes outliers visible. A pay equity audit runs an intersectional regression analysis within bands to flag gender or race pay gaps. Remediate flagged cases, document the process, and repeat the audit at least every compensation cycle to show active governance and satisfy OFCCP and state law requirements.
Lattice, Pave, and Syndio are leading purpose-built platforms. Lattice structures bands and compa-ratios against targets; Pave integrates live market data into band building; Syndio specializes in embedded pay equity analytics. A platform like CompUp ties those capabilities into centralized budget pools with real-time simulations and an auditable approval workflow.
State pay transparency laws in California, Colorado, New York, and Washington require posting a defensible salary range on job listings. Federal OFCCP rules add pay-data collection requirements. Together, they make having documented, market-anchored compensation bands a legal requirement. A posted range without a governed band behind it exposes the company to regulatory and litigation risk.
Community Manager (Marketing)
As a Community Manager, I’m passionate about fostering collaboration and knowledge sharing among professionals in compensation management and total rewards. I develop engaging content that simplifies complex topics, empowering others to excel and aim to drive collective growth through insight and connection.
Revolutionizing Pay Strategies: Don't Miss Our Latest Blogs on Compensation Benchmarking