Most employees believe they're underpaid. Most HR teams, on the other hand, believe their salaries are competitive. Both can't be right, and yet this contradiction plays out in all organisations, every single day, often ending in a resignation that could have been prevented.
The gap between what employees perceive and what companies actually pay usually comes down to one thing; and that is the absence of a clear, consistent way to measure pay positioning. Compa-ratio fixes exactly that.
In this article, you’ll learn what compa-ratio means, how to understand and calculate it and what insights to gain from it. You’ll also get clarity on how HR professionals across the globe use it and what are some mistakes to avoid when dealing with it. So, let’s get started.
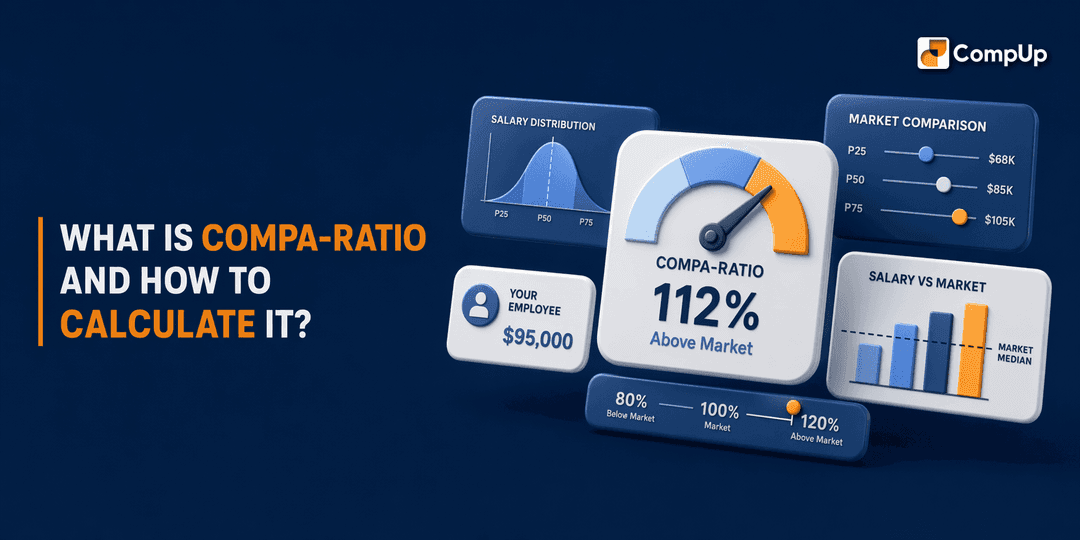
Compa-ratio, short for comparative ratio or compensation ratio, is a metric that compares an employee's salary to the midpoint of the pay range established for their role.
HR and payroll professionals use this percentage to evaluate whether employee compensation is competitive, equitable, and aligned with the organization's pay structure.
The calculation divides an employee's annual salary by the median salary for similar positions and multiplies the result by 100, yielding a percentage value. Compa-ratio is interpreted as:

It’s important to note that compa-ratio does not tell you whether someone is paid fairly in an absolute sense. It only tells you where they sit relative to where your organisation intended to pay for that role. That distinction matters, because interpretation always depends on context.
For instance, an 85% compa-ratio on someone six months into their role is completely normal. That same 85% on a three-year high performer who consistently exceeds expectations is a retention problem quietly building in the background.
The standard compa-ratio formula is straightforward: (Actual Salary ÷ Salary Range Midpoint) × 100.
Consider an employee earning $65,000 annually in a role with a salary range midpoint of $70,000. The calculation proceeds as follows:
$65,000 ÷ $70,000 = 0.93
So, 0.93 × 100 = 93% compa-ratio

A second example: an employee earning $47,000 against a midpoint of $49,000 yields $47,000 ÷ $49,000 × 100 = 95% compa-ratio.
Both results fall within the typical 80 to 120% range, with the employee paid slightly below market midpoint in each case.
Compa-ratios generally fall between 80% and 120%, with 100% considered market value. A ratio below 100% indicates pay below the midpoint, often appropriate for new hires or employees with growth potential, while above 100% reflects pay above midpoint, typical for high performers or tenured staff.
This 80-120% band serves as a practical control range: employees within it are compensated fairly relative to the market reference point, leaving room for merit increases without triggering compression or overpayment concerns.
Ratios below 80% flag potential underpayment risk, consistent top performers languishing at this level warrant attention. Conversely, ratios above 120% may indicate overpayment or grade inflation, suggesting either a highly experienced employee or pay compression that limits future raise headroom.
Both extremes require investigation: below-80% employees may be flight risks; above-120% employees may have reached the salary ceiling, reducing retention levers.
Compa-ratio moves from calculation to strategic action when HR teams apply it to pay equity audits.. This transforms the metric into an operational diagnostic that surfaces disparities and guides data-driven compensation decisions.
Let's explore that in detail, along with how CompUp, as a tool, supports it.

HR teams calculate compa-ratio by demographic cohort, gender, ethnicity, department, to reveal pay disparities across groups performing equal work. A 0.95 compa-ratio for one demographic segment and 1.05 for another in the same role flags potential inequity.
While compa-ratio alone does not prove discrimination, it identifies areas requiring deeper statistical investigation through regression analysis and adjusted gap metrics. CompUp supports by providing pay equity analysis that surfaces these patterns continuously, supporting equal-pay-for-equal-work compliance.
When employees with different tenure or performance levels cluster around the same compa-ratio, HR teams can identify underpayment, overpayment, and pay compression. For instance, a five-year high performer at 0.98 compa-ratio and a new hire at 0.96 compa-ratio signal compression, the veteran is underpaid relative to peers.
CompUp offers compa-ratio tracking and budgeting tools for informed compensation decisions, enabling real-time detection rather than annual snapshots.
Compa-ratio allows HR managers and finance teams to analyze compensation during merit cycles [6], allocating budget to employees below market midpoint before spreading increases broadly. Organizations also compare internal compa-ratios against market data to assess competitive positioning, most target 80-120% depending on performance and market conditions [3]. This dual application ensures merit budgets correct internal disparities while external benchmarking validates pay ranges against industry standards.
Also Read: Common Compa-Ratio Mistakes to Avoid
Even with the correct formula, several calculation and interpretation pitfalls can undermine compa-ratio analysis.
The most common calculation error is using the range minimum, maximum, or an outdated midpoint as the denominator. The compa-ratio formula divides employee salary by the market salary midpoint, deviating from the approved current midpoint produces a meaningless number and breaks the metric's ability to assess fair pay positioning.

Compa-ratio does not account for location-based ranges or remote work policies, the same salary can be fair in one market and misaligned in another. Without separate midpoints for different geographies, a single compa-ratio calculation masks real pay equity issues.
CompUp maintains geo-adjusted salary ranges and calculates compa-ratio within the appropriate location-specific midpoint, ensuring the metric reflects true market positioning across all regions.
Compa-ratio measures internal range position, not external market distribution position. An employee can have a 105% compa-ratio and 75% salary penetration, the former compares salary to the internal midpoint, while percentile positioning compares salary to the external market distribution. Treating these as equivalent leads to incorrect market competitiveness conclusions.
Manual spreadsheet-based compa-ratio tracking is sufficient for small teams with stable headcount, but scaling organizations benefit from automated dashboards that surface compression and equity gaps in real time across departments and locations. As remote work expands and pay transparency regulations tighten, HR teams will increasingly rely on real-time compa-ratio monitoring integrated with geographic pay differentials and performance data to maintain equitable, defensible compensation structures.
Start tracking compa-ratio in real time using CompUp's automated compensation analytics platform to identify pay equity gaps and compression risks before they escalate. Move beyond annual snapshots to continuous pay equity monitoring that adapts to your organization's growth.
A compa-ratio between 80% and 120% is generally acceptable, with 100% indicating pay aligned to the salary range midpoint[1]. Ratios below 80% may signal underpayment risk, while above 120% typically indicates overpayment or pay compression[1]. Context matters, new hires often sit below 100%, while high performers or tenured employees may exceed it.
Compa-ratio compares salary to the range midpoint (100% = midpoint), while salary range penetration measures how far salary has moved from minimum to maximum within the full range[4]. An employee can have a 105% compa-ratio and 75% salary penetration simultaneously, compa-ratio anchors to midpoint, penetration to the full band.
Yes, compa-ratio applies to any role with a defined salary range. For hourly employees, convert the hourly rate to an annualized salary equivalent before dividing by the range midpoint[3]. The formula mechanics remain identical: (Annualized Salary ÷ Salary Range Midpoint) × 100[1].
A compa-ratio above 100% means the employee is paid above the salary range midpoint, often reflecting high performance, long tenure, or specialized expertise[1]. Ratios above 120% may indicate overpayment, grade inflation, or pay compression that limits future raise headroom.
Compa-ratio should be recalculated at least annually during merit cycle planning, but leading HR teams track it quarterly or in real time[5][3]. Continuous monitoring identifies pay equity issues and compression early, enabling proactive interventions before disparities escalate[6].
No, standard compa-ratio does not adjust for geographic pay differentials unless the organization maintains separate salary ranges for different locations[7]. The same salary can be fair in one market and misaligned in another, without location-specific midpoints, a single compa-ratio calculation masks real equity issues.
The compa-ratio formula is: (Employee Salary ÷ Salary Range Midpoint) × 100[3]. This calculation produces a percentage that shows where an employee's pay sits relative to the midpoint of their salary range[1]. Use the range midpoint, not minimum or maximum, as the denominator.

Co-founder & Head of Product
Anshul Mishra, Co-founder and Head of Product at CompUp, blends technology and total rewards to create smart, user-friendly solutions. He focuses on building data-driven tools that help companies design fair and effective compensation strategies, making complex processes simpler and more impactful.
Revolutionizing Pay Strategies: Don't Miss Our Latest Blogs on Compensation Benchmarking