

You send the annual benefits statement confident the data is airtight. The employee opens it, scans the total employer cost figure, and feels nothing. Or worse, she misreads it as a bill. That's a communication design failure, and it's costing you retention you assumed the statement was building.
Northwestern University's model is a crisp demonstration of the gap. Its guide instructs employees to 'review your Total Compensation Statement,' which 'visibly demonstrates the value of your benefits package' and lists everything from annualized base pay to year-to-date university retirement contributions. The document is factually complete.
It pulls payroll, bonus, and benefit data into a single page. Yet the handoff is purely passive: log into myHR, find it, interpret it yourself. No narrative.
No market anchoring. No 'here is what this means for your family.'
Industry consensus holds that employees who cannot decode their total rewards show markedly lower engagement and weaker retention ties. You are spending six figures per employee in some cases, and the proof sits unread in a self-service portal. This article diagnoses what breaks between your cost data and their comprehension, then provides the structural fix to turn a transactional document into a retention asset.
The core failure is a design and narrative gap, not an employee skill deficit. Static statements dump cost data without translating it into personal, contextualized value. What follows are the core drivers and the operational remedies.
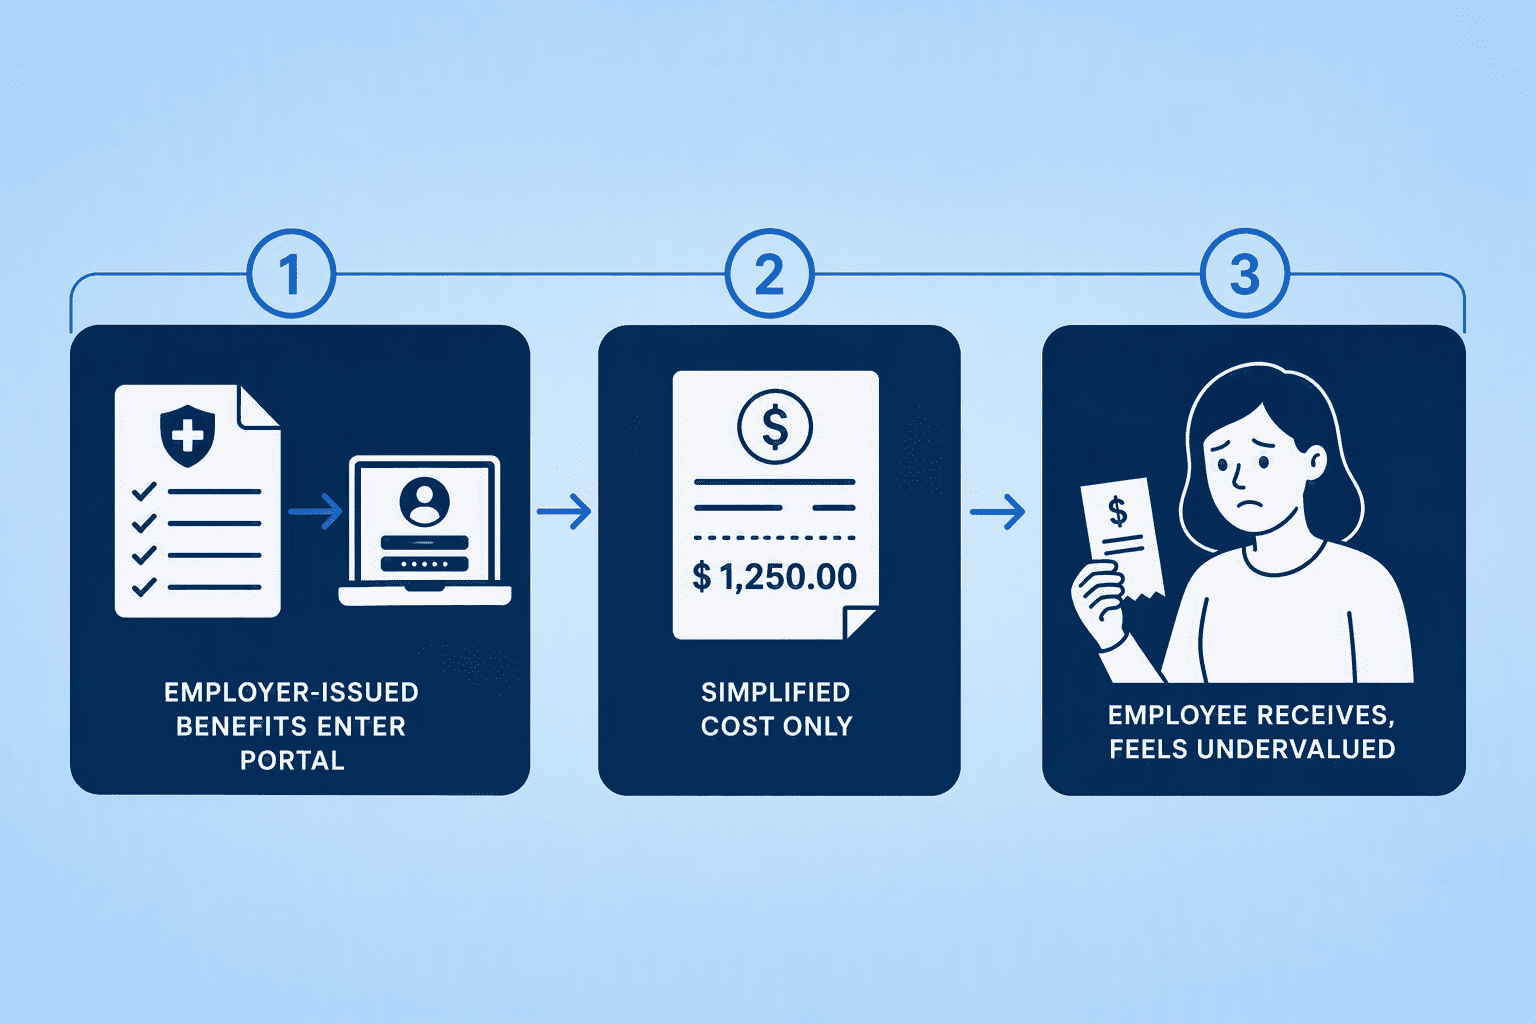
The format itself conditions employees to undervalue what you spend. Here is where the standard approach breaks down.
The most practical way to make total compensation land with an employee is to frame it as forgone income. Every dollar an employer spends on health premiums, retirement contributions, and payroll taxes is a dollar the employee does not have to earn and spend on the open market. When you present employer-paid health coverage or a 401(k) match as a subtraction from what the employee would otherwise pay out of pocket, the number shifts from an abstract expense into something the employee can weigh against a competing offer.
Northwestern\'s Total Annual Compensation model assembles this into a single figure. It rolls up annualized base pay, bonuses paid year to date, other payments, annualized university contributions to benefits, and year-to-date retirement plan contributions. The statement also surfaces retirement plan account balances across the primary plan, voluntary savings plan, and rollovers. That figure is the hidden paycheck. The job of the statement is to land the message: leaving this company means replacing that amount with post-tax cash on your own, or accepting that a portion of your current standard of living was subsidized by the employer.
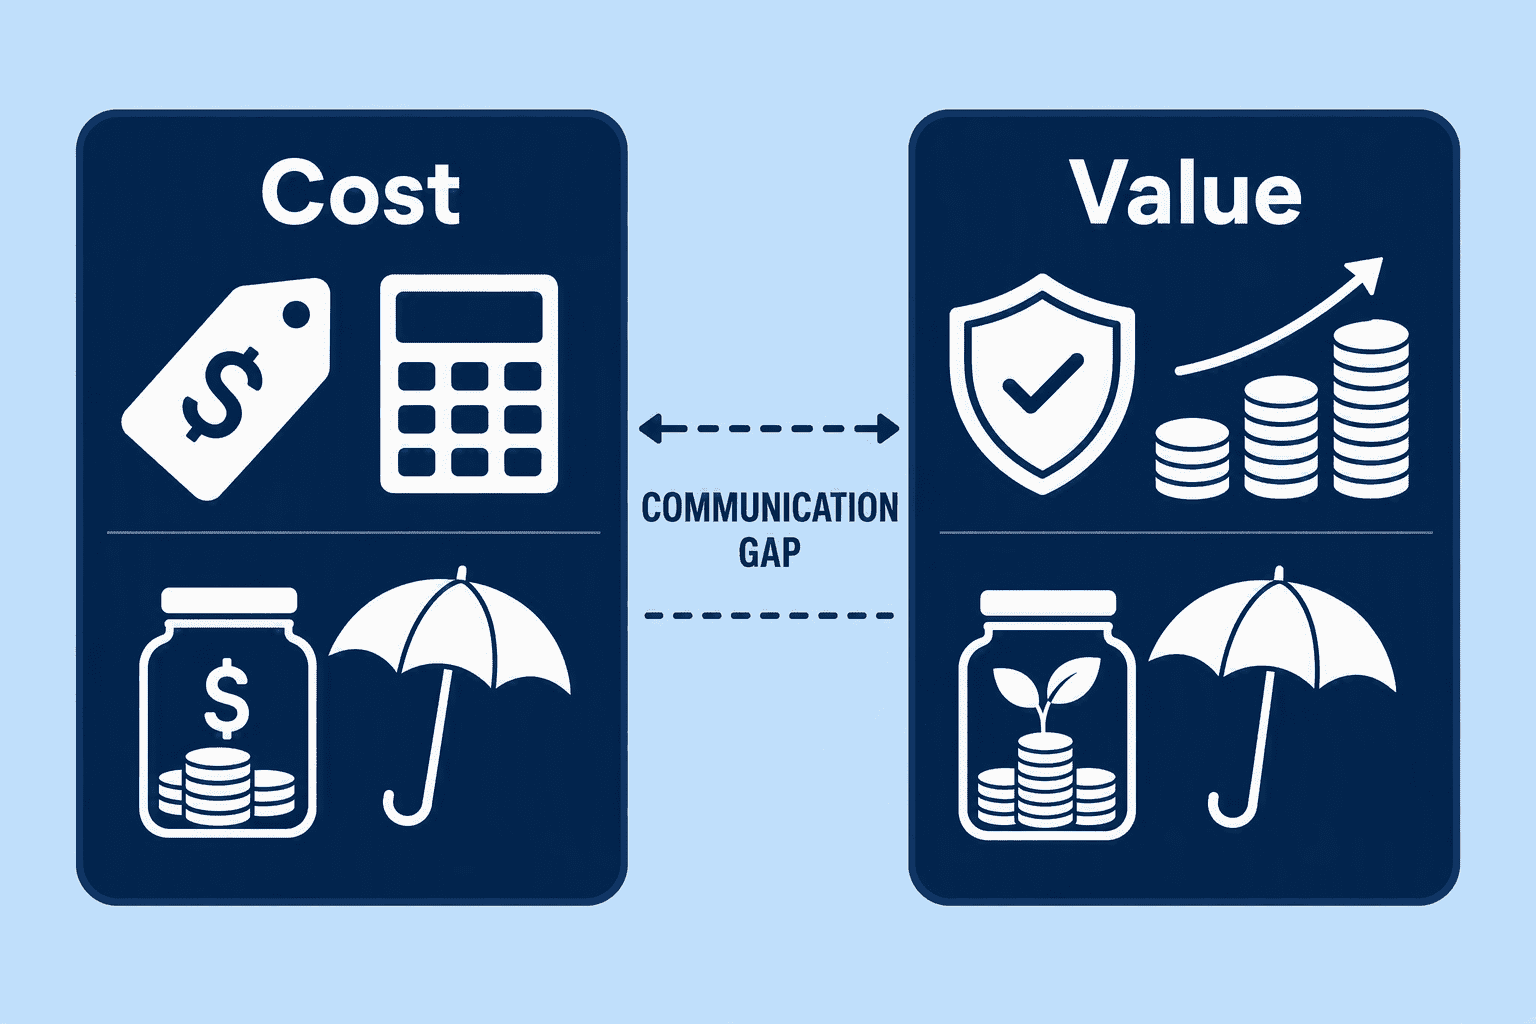
Two distinct frames sit on opposite sides of the same statement, and most employers send only the first one. The table below contrasts what HR reports versus what the employee needs to register if the numbers are going to influence retention and engagement.
| Dimension | Employer-Perspective (Cost Display) | Employee-Perspective (Value Translation) |
|---|---|---|
| Health premiums | Employer share listed as an annualized plan cost. | 'This is income protection you do not pay out of pocket. On the individual market, this coverage would cost you $X annually.' |
| Retirement contributions | Year-to-date employer contribution shown as a cumulative deposit. | 'This is an annual cash match that compounds over your vesting schedule. Your projected account balance at full vesting is $Y.' |
| Equity grants | Grant date and number of units listed; no forward-looking valuation. | 'If the company grows at a conservative Z% annually, the estimated value of your grant at a liquidity event falls between $A and $B.' |
| Payroll taxes | Employer-paid FICA and unemployment taxes itemized as statutory costs. | 'These are mandatory contributions that support your future Social Security and unemployment safety net, costs your employer carries so your gross pay stays intact.' |
| Narrative | No statement of philosophy or market positioning. | 'We pay at the 60th percentile of the market because we are building a team that stays for a decade.' |
When only the left column arrives, employees heavily discount everything below the base salary line. The result is a retention number that looks worse than your spend would predict, because the spend was never translated into a reason to stay.
The fix is a digitally delivered, employee-perspective document built on automation and personalization. Here is the structural overhaul in sequence.
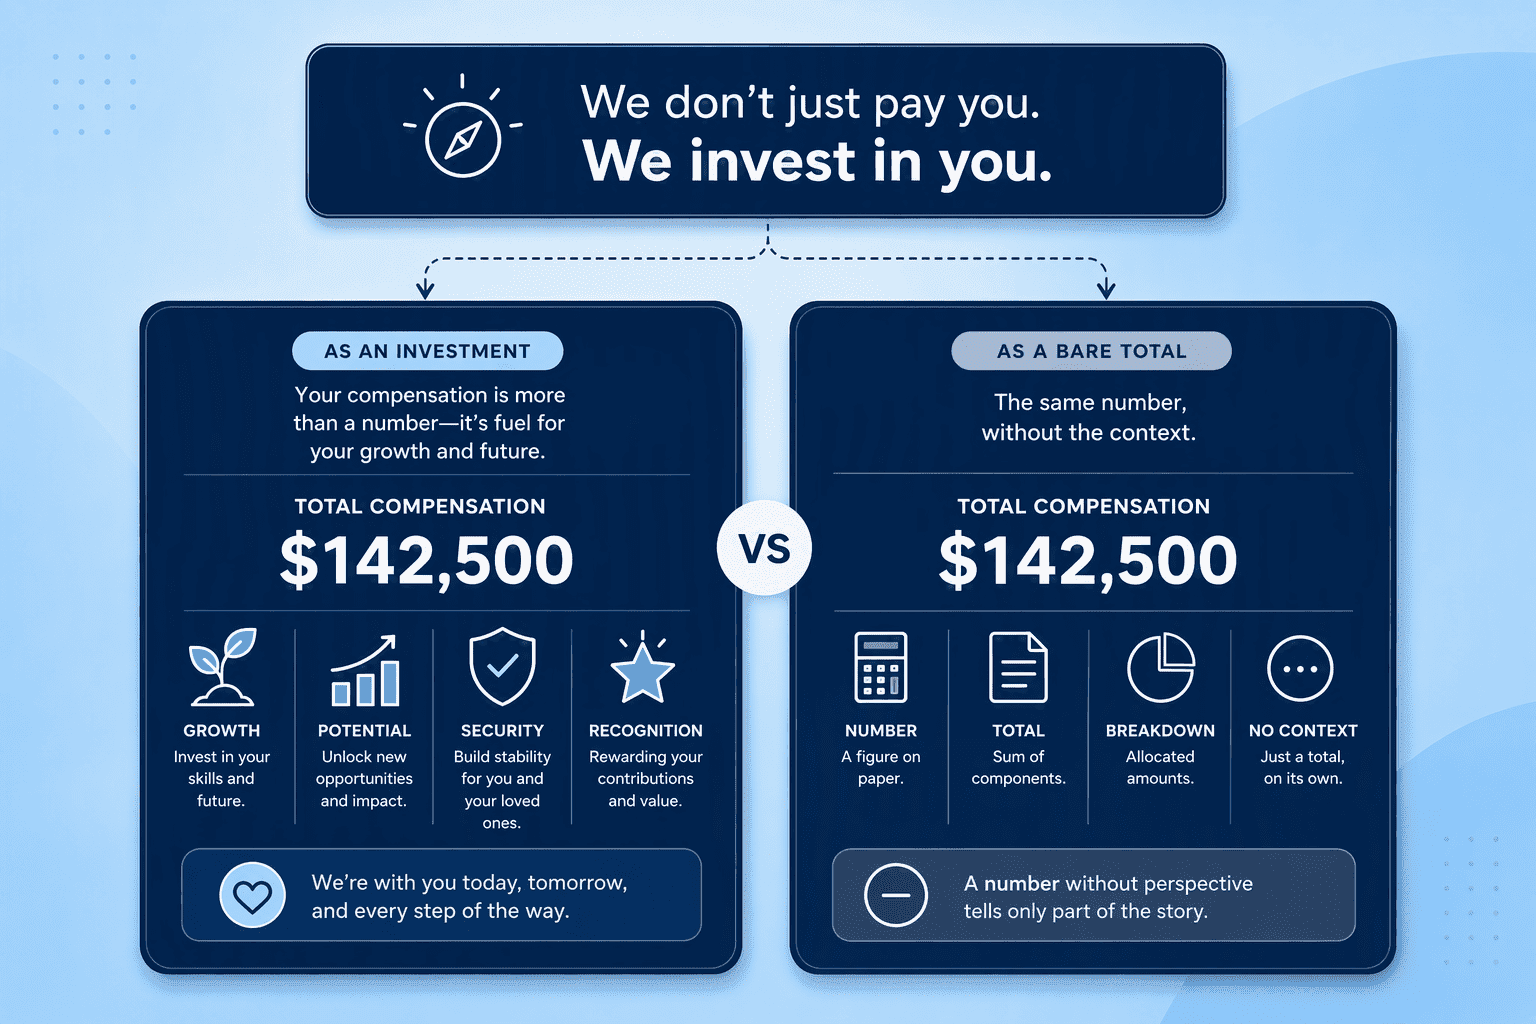
A financial statement without a philosophy is an inert record. It tells the employee what was spent. It does not tell them why. The absence of narrative is why the same $120,000 total compensation figure can land as generous at one company and insulting at another with an identical number. The difference is whether the employer framed the number as a deliberate investment decision.
Your compensation philosophy should sit at the top of the digital statement in plain, declarative language. It answers three questions:
This is not just about setting pay scales. When an employee reads 'We set base pay at the 55th percentile of our peer group and differentiate with equity because we want everyone thinking like an owner,' the statement becomes a strategic document, not an accounting notice.
The psychology flips. A number with no context forces the employee to fill the void with their own assumptions, which often trend negative. A number with a clear philosophy preempts the internal negotiation. The employee can disagree with the philosophy, but they cannot claim the employer was arbitrary. That shift alone moves the statement from a compliance artifact to a trust asset.
What this means operationally: write the philosophy once, embed it as the first section, and do not adjust it for individual employees. The document demonstrates consistency, and consistency is what builds credibility over annual cycles.
## Making Equity Real: Demystifying ESOPs and Stock Value
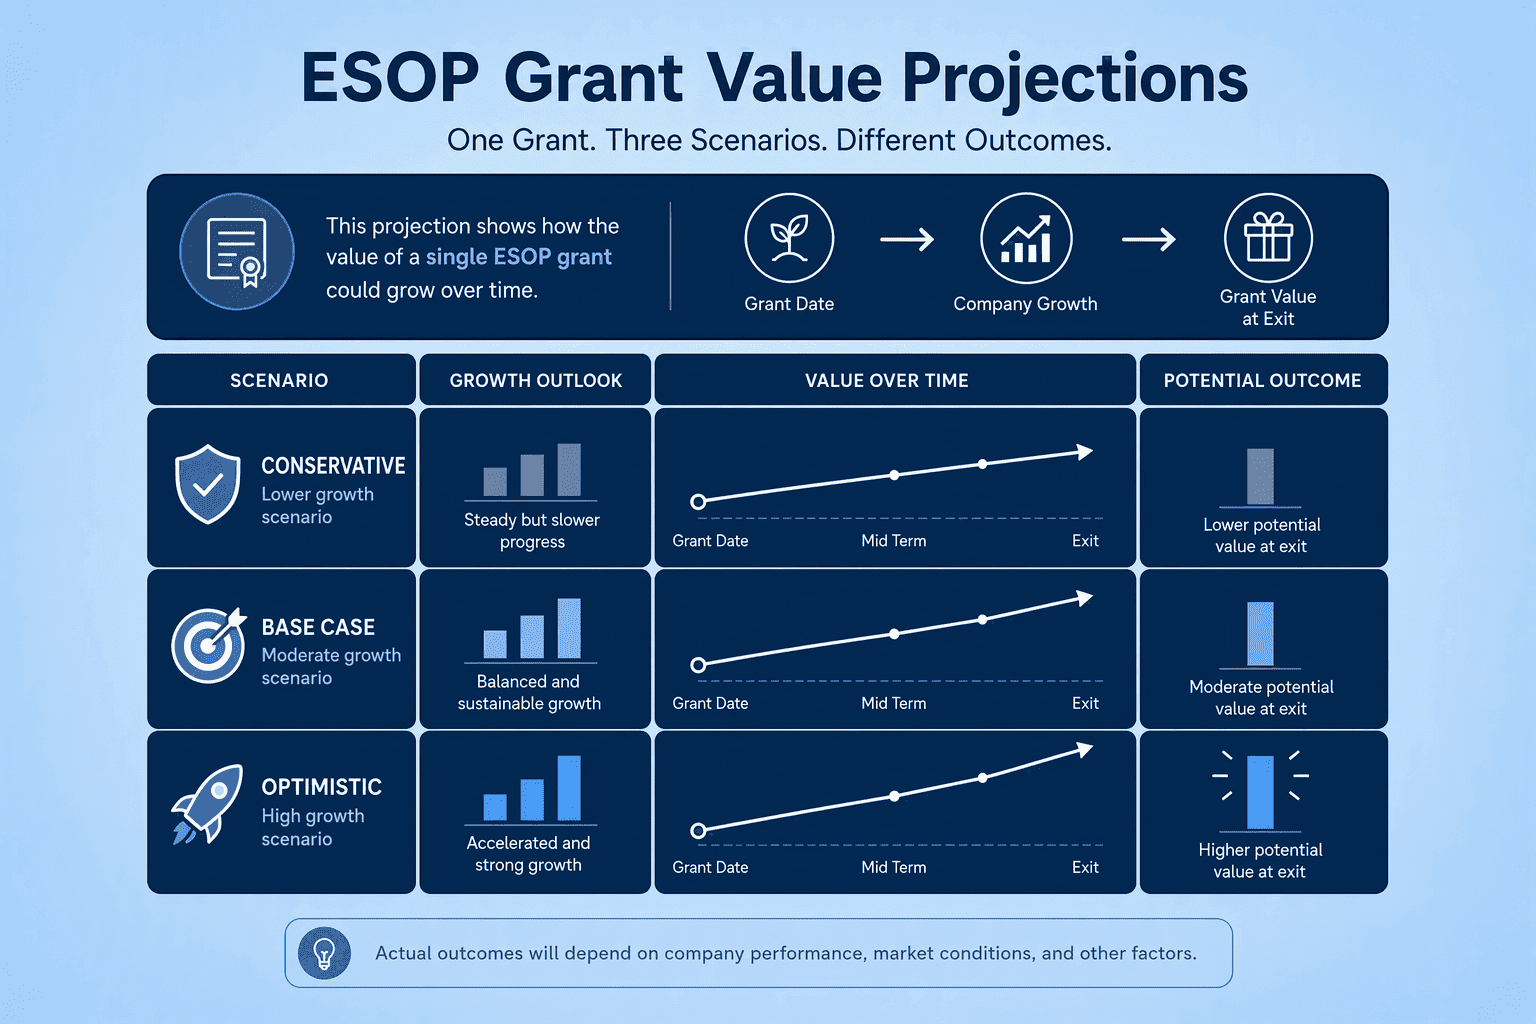
Equity is where the comprehension gap is widest. Employees receive a grant notice with a number of units and a vesting schedule, neither of which translates automatically to a dollar amount they can use to make decisions. The fix is scenario modeling.
Stop handing out glossaries and start showing projections. A digital statement should display a simple projection table: if the company’s valuation grows at a conservative, base, and optimistic rate over the vesting window, here is the estimated pre-tax value of your grant in each scenario.
BambooHR’s Total Rewards module communicates the current and predicted value of equity offerings so nothing gets lost in translation. Pair that with a one-line explanation: 'This is a projection, not a guarantee; your actual value will depend on company performance and liquidity events.' The employee walks away with a range and an assumption.
Employees evaluate total compensation through one overriding lens: 'Am I being treated fairly compared to people doing this job elsewhere and people doing this job here?' A statement that only shows their own numbers answers neither question. It demands trust without providing evidence.
Adding market-positioning context closes that gap without violating individual privacy. Show the employee where their total compensation sits relative to the company's stated percentile target and relative to the market range for the role. You do not need to expose peer salaries. You need to demonstrate that the number was set against a known benchmark, not invented in isolation. CompUp enables this by providing data-driven salary benchmarking and pay equity analysis tools alongside governed approval workflows, letting you surface percentile context inside the personalized statement. When the employee sees 'You are at the 62nd percentile of the market for your role and performance band,' the statement transforms from a one-way notice into a document of good faith.
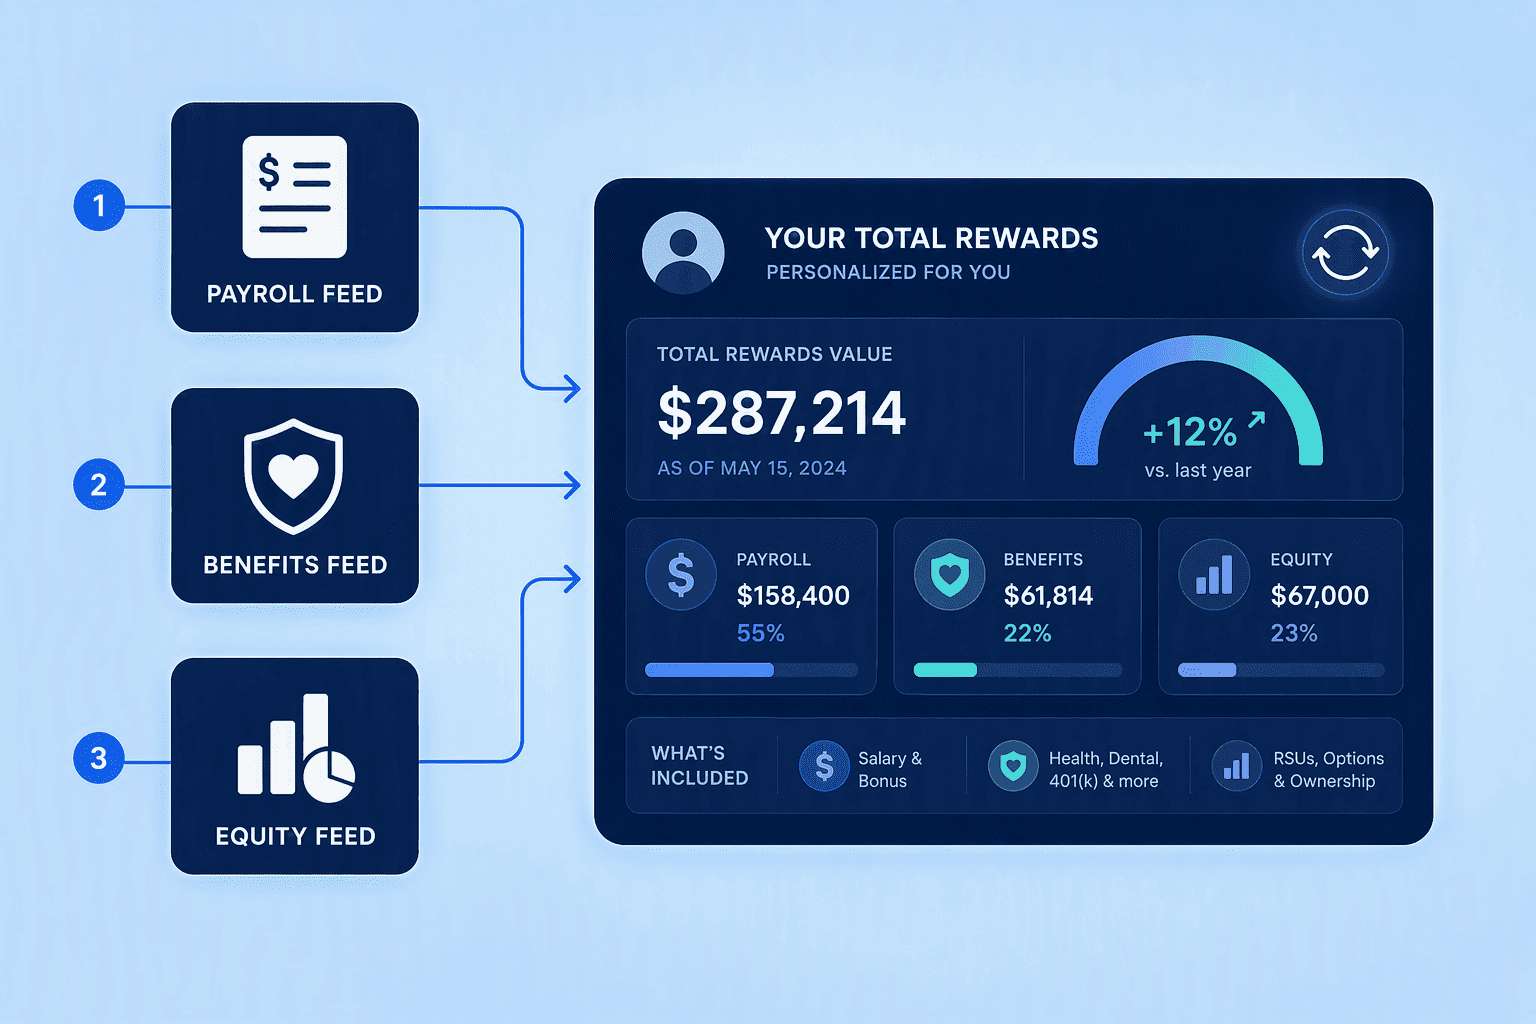
The passive self-service model Northwestern exemplifies breaks because manual compilation guarantees stale, error-prone, narrativeless output. The vendor landscape has consolidated around a clear alternative: platforms that extract disparate payroll, benefits, and equity feeds and render them as personalized visual statements on a refreshable cycle.
The passive self-service model Northwestern exemplifies breaks because manual compilation guarantees stale, error-prone, narrativeless output. The vendor landscape has consolidated around a clear alternative: platforms that extract disparate payroll, benefits, and equity feeds and render them as personalized visual statements on a refreshable cycle. CompUp addresses this engineering challenge by combining payroll, variable compensation, and benefits enrollment data from fragmented back-end programs into a meaningful context with instructional text and analytics. The platform's compensation-specialized approach simplifies extraction into a configurable solution that lets organizations define the reward components relevant to their population while connecting pay transparency and compensation clarity directly to trust and engagement metrics.
CompUp addresses this engineering challenge by combining payroll, variable compensation, and benefits enrollment data from fragmented back-end programs into a meaningful context with instructional text and analytics. The platform's compensation-specialized approach simplifies extraction into a configurable solution that lets organizations define the reward components relevant to their population while connecting pay transparency and compensation clarity directly to trust and engagement metrics.
CompUp operates in this landscape as a compensation-specialized platform with integrated pay equity analysis, total rewards communication, and compensation planning tools. The platform's design is to turn multi-source compensation data into a single employee-facing breakdown that connects pay to a documented philosophy rather than leaving figures to speak for themselves.
Most employees who glance at a total compensation statement and see a column of expenses aren't failing to understand the document. They're responding to a document designed for the wrong audience. The fix runs through three gates.
First, reframe employer contributions as income the employee would forfeit by walking out the door. Second, automate the data extraction and personalization so every statement stays current without manual gymnastics. Third, open each statement with a compensation philosophy that explains why the numbers exist instead of just listing them.
CompUp now supplies the data plumbing to make a monthly cycle operationally realistic. What remains is a single decision: whether the document serves your accounting team or your retention strategy. A good next step is seeing how CompUp puts this into practice. Book your free demo today.
They default to static, cost-centric data dumps without narrative context or personalization. The employer lists contributions as line-item expenses rather than framing them as income the employee would need to replace on the open market, which causes the value to register as an accounting artifact rather than a personal asset.
The primary gap is framing: HR reports employer costs while employees need to see value translated into their personal financial reality. Without market positioning context, projected equity scenarios, or a compensation philosophy explaining why the numbers are set as they are, employees default to undervaluing everything beyond base salary.
Move from a static PDF to a digital, personalized statement that opens with a compensation philosophy, separates employer investment from statutory deductions, projects value based on the employee’s life stage and vesting schedule, and uses plain-language summaries rather than benefit-jargon line items.
Total compensation includes employer-paid health premiums, retirement contributions, payroll taxes, equity grants, bonuses, and perks. Framed as a 'hidden paycheck,' these components represent income the employee would need to earn and spend independently if they left the company, making the statement a direct retention instrument.
A compensation philosophy gives the numbers a strategic 'why' by stating the employer’s market positioning, benchmark sources, and pay-mix trade-offs. This prevents employees from filling the context gap with negative assumptions and reframes the statement from an administrative receipt into a documented good-faith investment decision.
Community Manager (Marketing)
As a Community Manager, I’m passionate about fostering collaboration and knowledge sharing among professionals in compensation management and total rewards. I develop engaging content that simplifies complex topics, empowering others to excel and aim to drive collective growth through insight and connection.
Revolutionizing Pay Strategies: Don't Miss Our Latest Blogs on Compensation Benchmarking