
More than half of employees would trade base pay for better benefits, yet most never calculate their total compensation value. The gap isn't technology—it's comprehension.
Total rewards statements, compensation benchmarking platforms, and benefits portals all help employees see their full package — but they only work when employees actually understand what they're looking at. The biggest obstacle isn't technology; it's comprehension. When employees evaluate job offers or annual reviews, most focus exclusively on base salary and overlook the cost of benefits, retirement contributions, and employer-paid insurance. That narrow view can lead to poor career decisions: a lower base salary paired with thorough benefits often delivers higher total compensation than a higher salary with minimal perks.
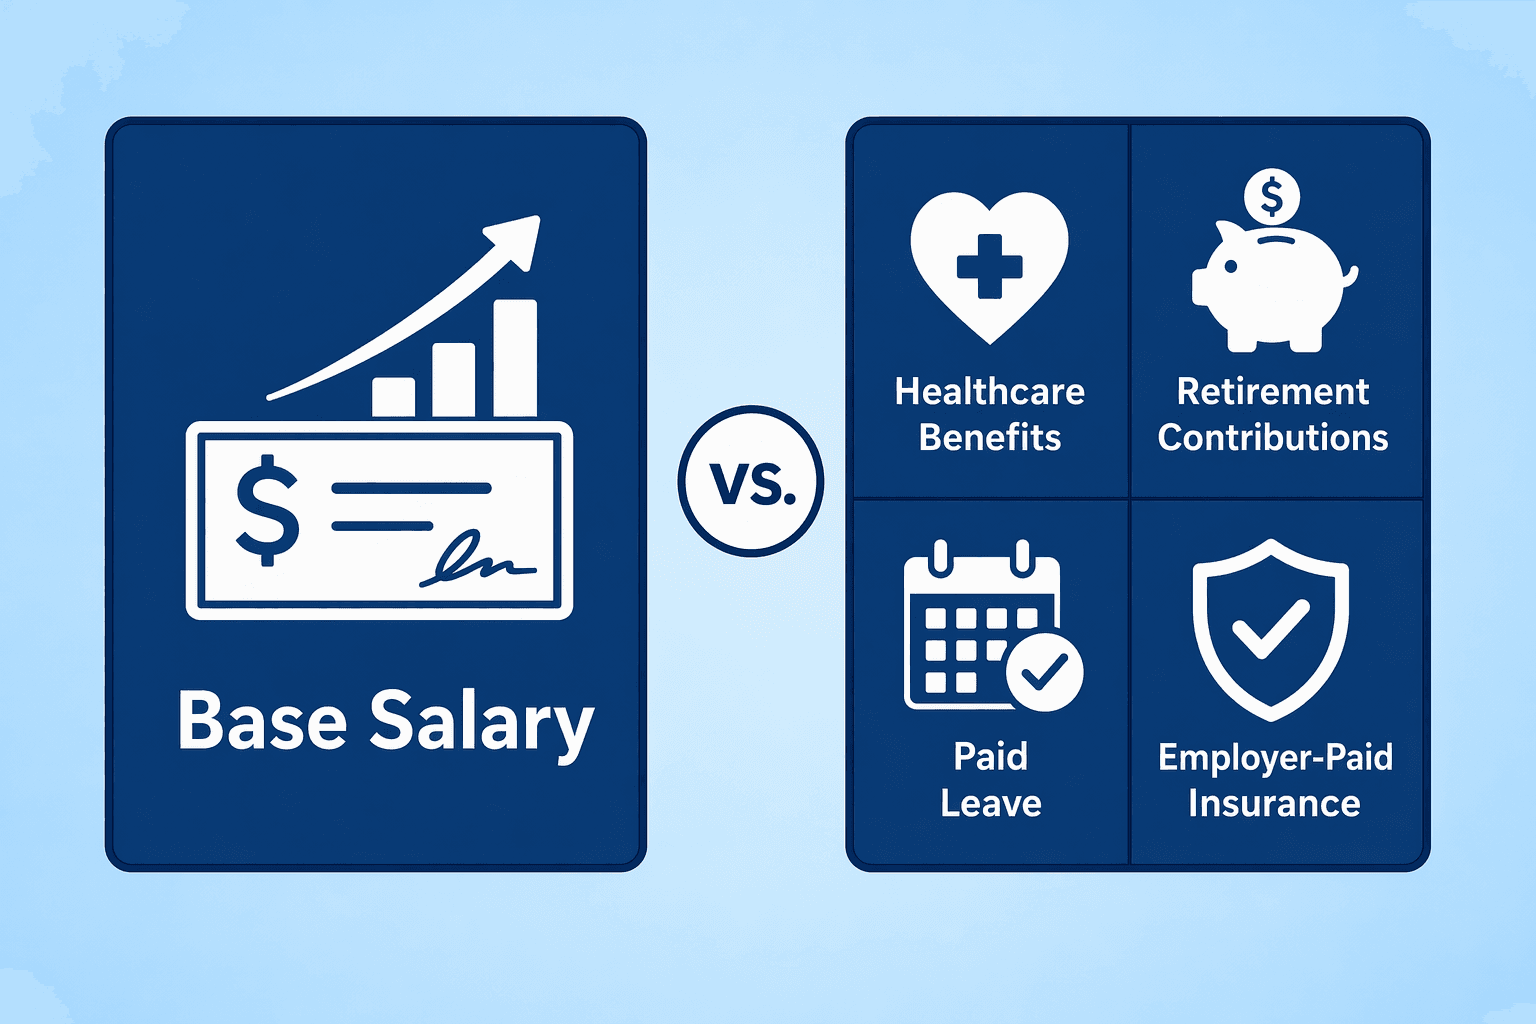
More than half of employees surveyed would accept lower base pay in exchange for a more strong benefits package, yet many never calculate what their total compensation actually is. One worked example from Odyssey Advisors shows two offers: $60k base with 50% employee-paid insurance versus $55k base with 100% employer-paid insurance and a 5% retirement match. The second offer delivers $80,925 in total compensation compared to $73,460 for the first — a $7,465 difference that disappears when employees only compare salary numbers.
What this means: even well-designed total rewards programs fail when employees can't decode them. Three root causes drive the comprehension gap:
Before selecting software or designing statements, establish the strategic foundation that determines what you'll communicate and why.
A transparent compensation philosophy explains how pay decisions are made and why rewards are structured as they are. This foundation supports clear communication about the full value of an employee's benefits package. At minimum, your philosophy should address four components:
Many organizations document these principles in an internal guide and share summaries with employees through onboarding materials or dedicated compensation portals. Platforms like CompUp, HRIS systems, and even structured spreadsheets can help standardize how you present this framework to your workforce.
Not every organization adopts the same level of pay transparency. Legal requirements and cultural context vary by jurisdiction, so consult legal counsel before finalizing your approach. The spectrum typically includes:
Each level carries trade-offs: full transparency can build trust but may surface uncomfortable pay gaps; band-based disclosure offers structure without exposing individual data; no disclosure protects privacy but can fuel speculation. Choose the model that aligns with your culture and compliance obligations, then communicate the rationale clearly.
Suggested Read: For step-by-step guidance on building and documenting your compensation philosophy, see CompUp's pay philosophy framework guide.
Suggested Read: Step 2: Collect and Validate Compensation Data
Once your philosophy is documented, the next step is gathering the numbers that will populate your statements, and ensuring those numbers are accurate.
Accurate data is the foundation of any total rewards statement. Before distribution, you need a clear workflow for collecting every component, direct pay (wages, salary, bonuses) with indirect compensation such as insurance, retirement contributions, paid leave, wellness programs, and employer-paid taxes, and then validating that data across systems to avoid errors that undermine trust.
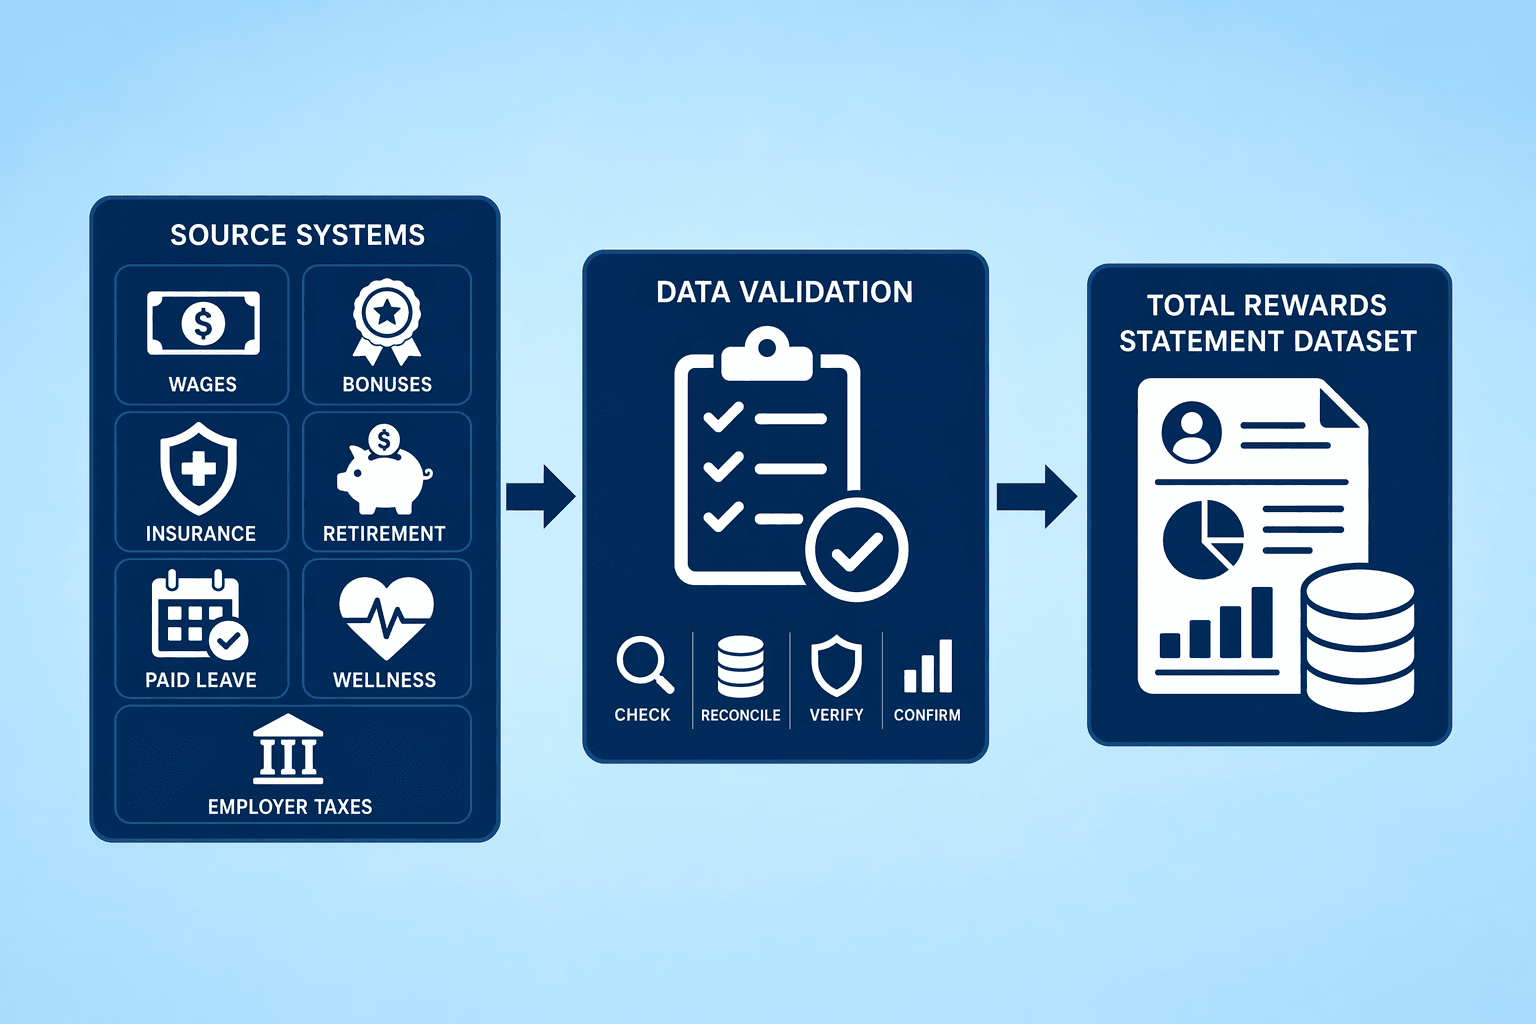
Map where each data element lives before you start pulling reports:
For terminology clarity, refer to our guide on salary vs annual compensation to ensure your data labels match what employees expect to see.
Once you've pulled the data, run it through a three-layer validation process:
Platforms like CompUp simplify this workflow with smooth integration with HRIS, payroll, and performance management systems, automatically pulling and cross-checking records to reduce manual reconciliation time and flag discrepancies before statements go live.
Key Takeaways: Outdated or incomplete data is a common pitfall, validation is the control point. Modern HR tools make the process easier than ever, but only if you build the workflow to catch errors before employees see them. Request a Demo to see how automated validation reduces administrative effort while ensuring accuracy.
With clean data in hand, you can now focus on how employees will actually see and interpret their total rewards.
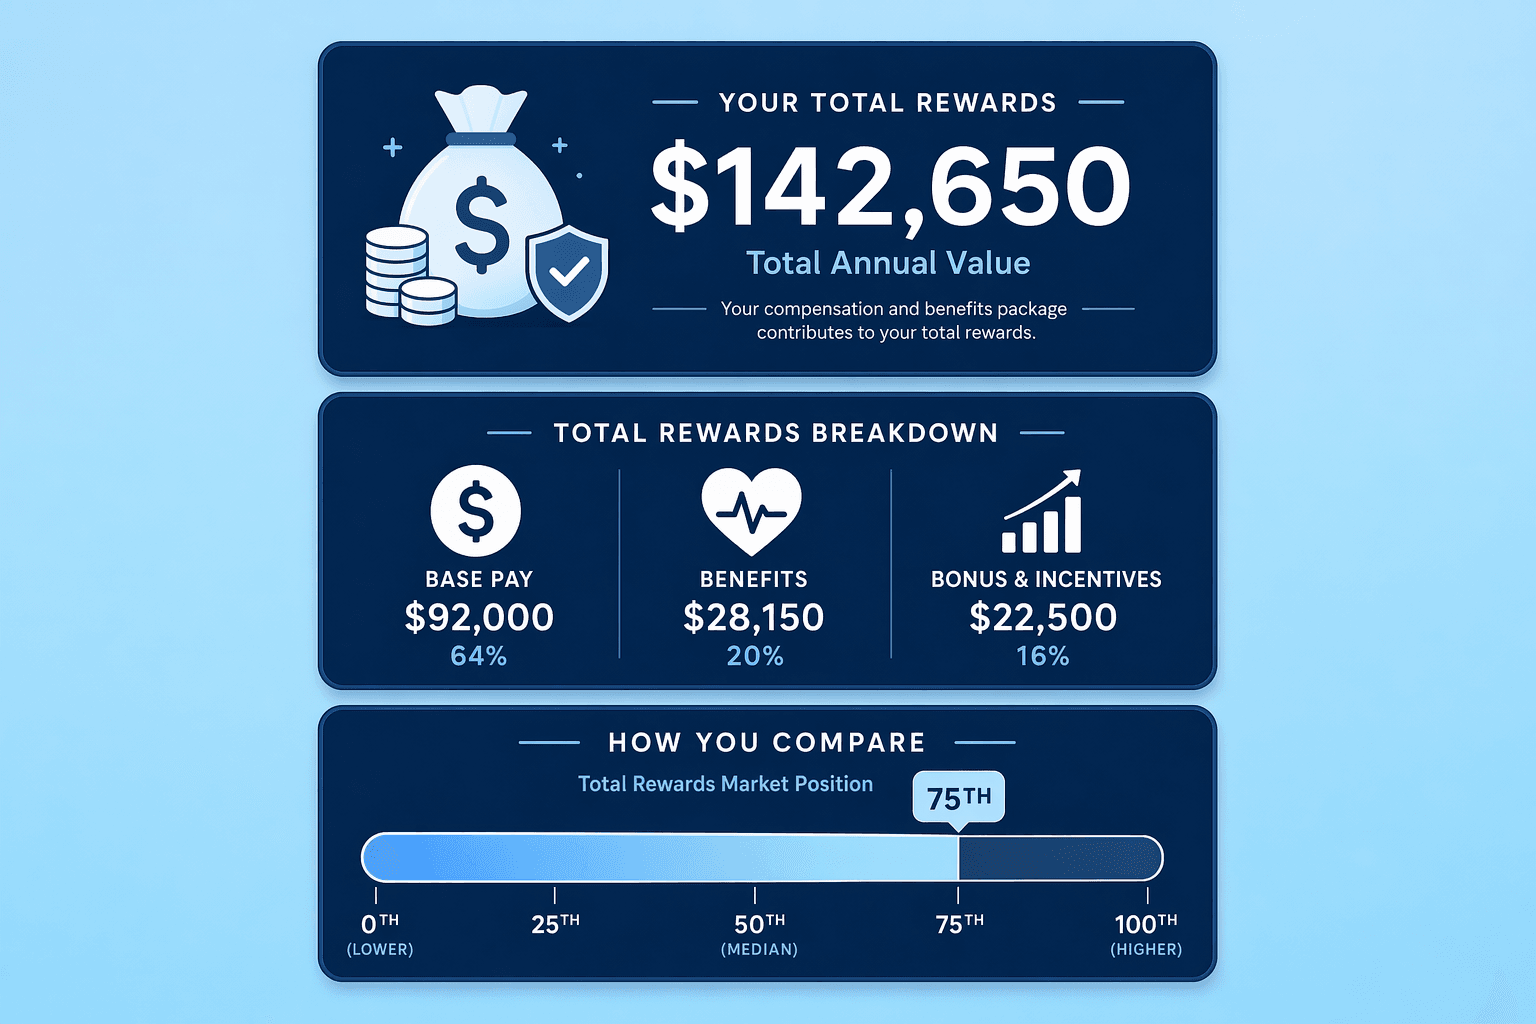
Key Takeaways: Total rewards statements become actionable when they prioritize visual hierarchy, personalization, and contextual benchmarks. Raw numbers without design structure or market positioning leave employees confused about their competitive standing.
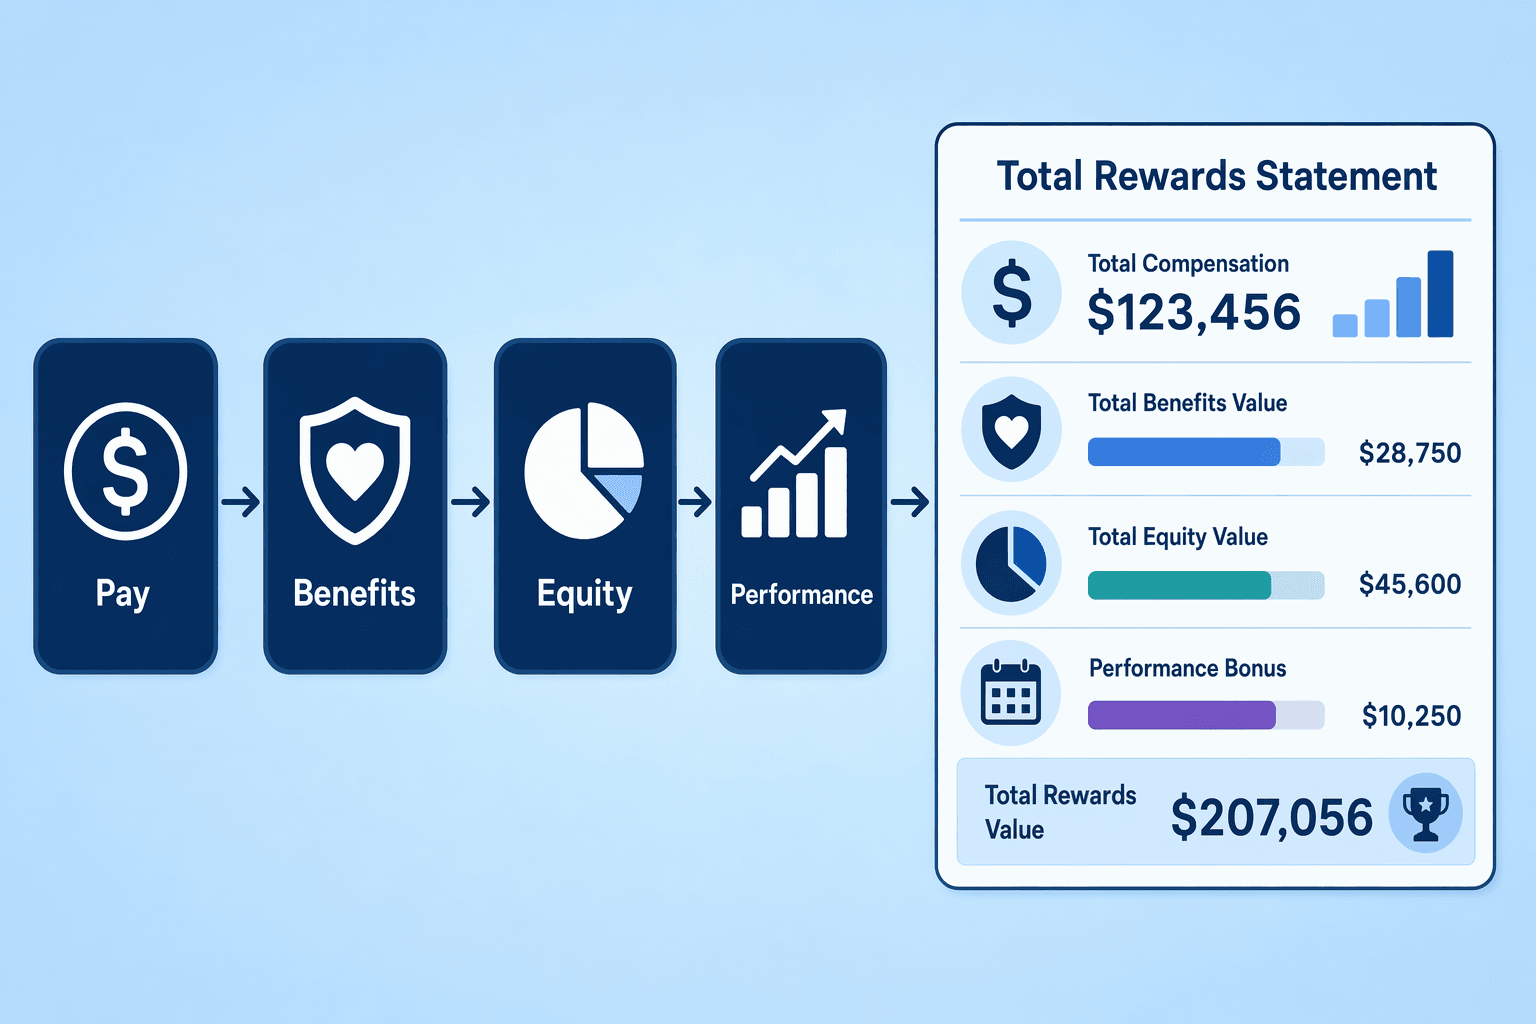
Structure statements with three tiers:
(1) a summary at the top showing total compensation in a single figure,
(2) category breakdowns detailing [salary, bonuses, healthcare, retirement contributions and perks add up to real value](), and
(3) contextual footnotes explaining benefit valuations and eligibility rules. Use tables or charts to present [salary, benefits, incentives and perks]() in [a clear, easy-to-understand snapshot]() format, avoiding dense paragraphs that bury critical data.
Personalize every statement with [employee name, job title, department and location](), plus tenure and role-specific details. Add market percentile positioning (e.g., "Your base salary is at the 68th percentile for your role in your region") and rationale statements (e.g., "Your equity grant reflects your tenure and performance rating").
These contextual benchmarks transform generic summaries into actionable insights. CompUp automates this personalization by pulling real-time benchmark data directly into statements, eliminating manual data entry and ensuring every employee sees their full compensation picture. CompUp's pre-built statement templates optimize for clarity while supporting custom branding for enterprise clients.
A well-designed statement is only effective if it reaches employees through channels they actually use, and if they understand what they're reading.
Choosing the right communication channel depends on organization size and update frequency. For small teams (<100 employees), annual PDF statements paired with manager-led sessions offer a low-tech, high-touch approach, ideal when benefits packages change infrequently and HR bandwidth allows for personal explanations.
Mid-market organizations (100 to 1,000 employees) benefit from always-on self-service dashboards supplemented by quarterly webinars: dashboards give employees real-time access to their total rewards data, while webinars address common questions at scale.
Research on media richness theory suggests that complex decisions (like choosing between high-deductible health plans and traditional PPOs) require richer channels, video or in-person, while straightforward updates (contribution limits, policy documents) work well in lean formats like PDFs.
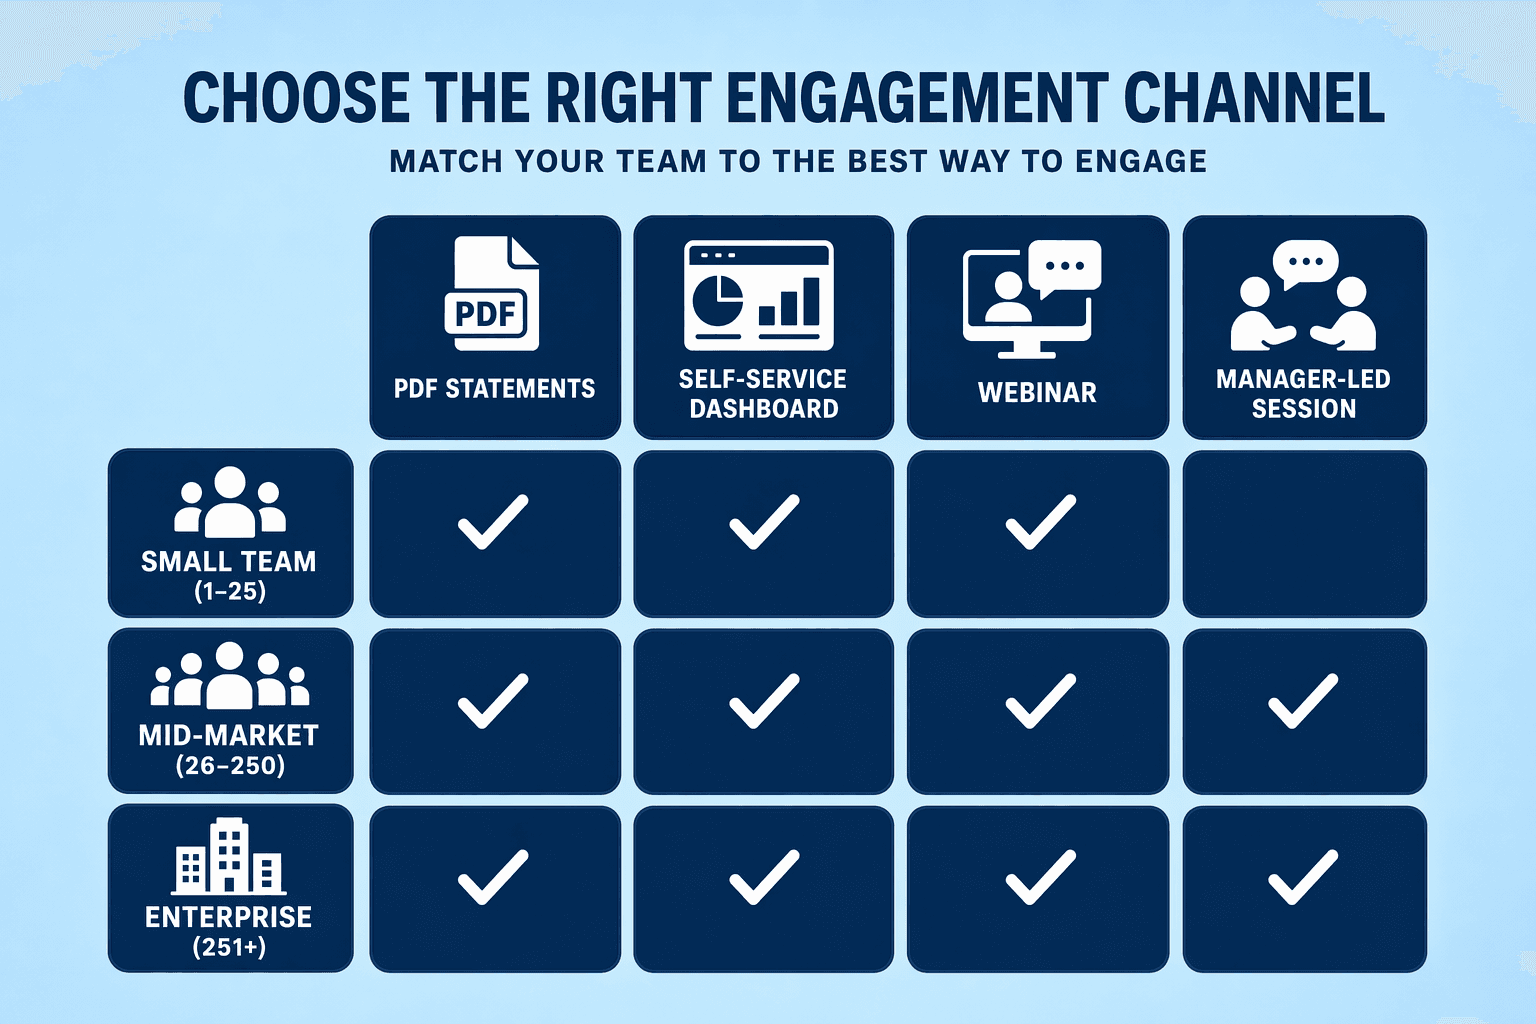
Enterprise employers (1,000+ employees) typically combine always-on dashboards with automated onboarding modules to deliver interactive and dynamic statements that give employees a full breakdown of compensation, bonuses, and benefits. Dashboards require HRIS integration and IT support but eliminate the lag between a promotion and an updated statement. Static PDFs, by contrast, become outdated the moment they're distributed, a critical gap when compensation changes mid-year. In-person sessions scale poorly beyond a few hundred employees but excel at building trust and answering nuanced questions during life events (marriage, childbirth, retirement planning).
CompUp's self-service portal exemplifies the dashboard approach: it integrates with HRIS systems to auto-update when compensation changes, giving employees on-demand access to their total rewards breakdown without waiting for annual print runs. Contrast this with PDF-only strategies, which leave employees working from stale data for months. The trade-off is clear, dashboards demand upfront technical investment, but they eliminate the recurring cost of producing and distributing paper or PDF statements each cycle.
A single annual statement won't move the needle on benefits utilization. Effective communication layers multiple touchpoints throughout the employee lifecycle. Start with onboarding: embed total rewards modules into new-hire orientation so employees see the full value proposition before their first paycheck. CompUp's digital onboarding tools can be integrated into onboarding flows, addressing candidate engagement and retention from day one. Follow up with quarterly webinars on high-impact topics, HSA strategies, FSA deadlines, mental health coverage, timed to coincide with benefits decision windows or policy updates.
Manager training closes the last-mile gap: frontline managers answer more benefits questions than HR does, so equip them with simplified talking points and FAQs. Provide managers with one-page summaries of plan changes, contribution limits, and enrollment deadlines so they can field questions without escalating to HR. Reinforce these efforts with year-round nudges through your chosen channel, email reminders about open enrollment, in-app notifications when FSA balances run low, or chatbot prompts when employees search benefits keywords on your intranet. What this means: benefits communication isn't a once-a-year event; it's a continuous loop of education, feedback, and adjustment.
Suggested Read: For a deeper dive into channel strategy and how technology supports multi-channel approaches, explore the CompUp podcast on total rewards communication.
Distribution alone doesn't guarantee comprehension. To close the understanding gap, you need to measure what's working and iterate based on feedback.
Track employee understanding through three measurement approaches:
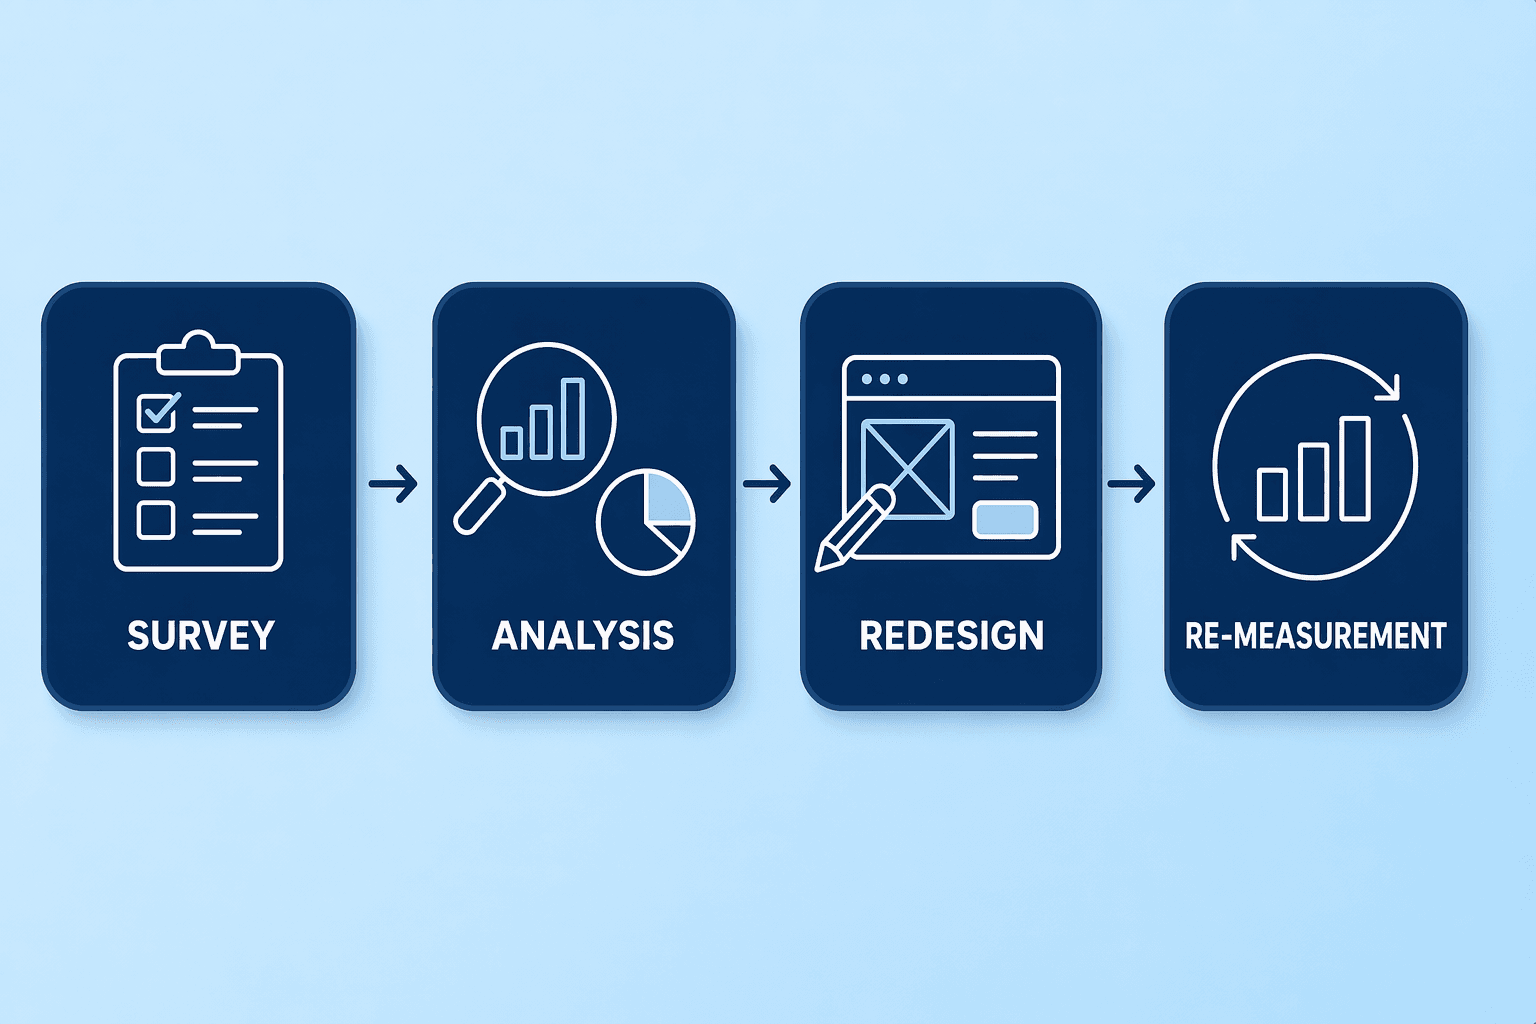
Run a quarterly feedback-to-action loop: survey in Q1, analyze gaps in Q2, implement fixes (redesign statement sections, add FAQs, schedule webinars ) in Q3, re-measure in Q4. Employees need to hear multiple times and in multiple ways, monthly or every other month, so each cycle refines messaging cadence and format. What this means: even with measurement, total rewards communication won't eliminate all comprehension issues; the goal is continuous improvement, not perfection.
Also Read: Tools That Support Total Rewards Communication
The five-step framework above can be executed manually, but specialized platforms accelerate the process, especially at scale.
Specialized platforms automate the generation and distribution of personalized total rewards statements.
CompUp provides a Total Rewards Portal that delivers thorough, transparent statements integrating compensation data and benchmarks into a unified view.
Pequity offers a flat-rate plan at $199/month with unlimited statement generation pulled directly from compensation cycle data, enabling HR teams to produce polished letters in hours rather than weeks.
CompBldr claims it delivered 2,800 personalized statements in four days, work that previously required three weeks of manual effort with spreadsheets and vendor PDFs.
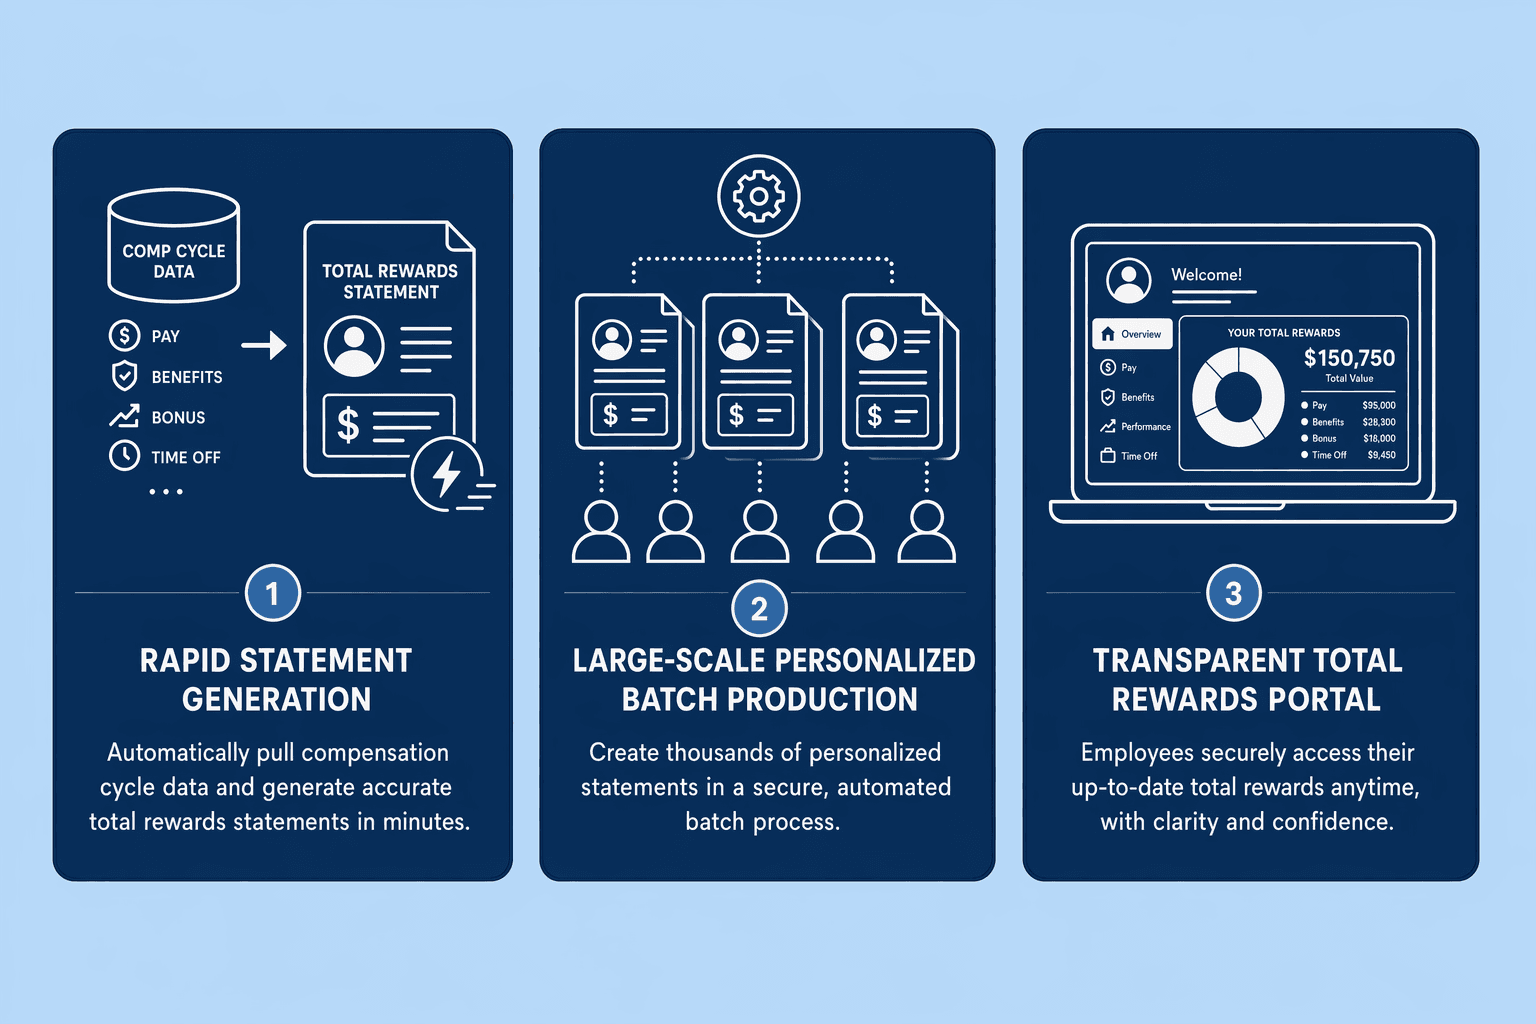
Broader HR platforms often embed total rewards communication as a module within benefits administration or employee self-service suites. These tools centralize payroll, benefits enrollment, and reporting, allowing employees to access their full compensation picture alongside core HR functions. Industry roundups highlight that many mid-market and enterprise platforms bundle statement generation with survey management, appraisal workflows, and compensation planning, making it easier for organizations to manage the entire rewards lifecycle without switching between disparate systems.
Decision factors include organization size, existing HRIS integrations, and customization requirements. Smaller teams may prefer flat-rate, standalone statement builders that require minimal setup, while larger enterprises often need platforms that integrate with payroll and benefits systems at scale. Evaluate whether the tool supports real-time benchmarking integration, CompUp's platform brings together all compensation data and benchmarks, enabling organizations to contextualize total rewards against market trends and reinforce the principle of providing context beyond raw numbers.
Manual spreadsheet-based statements work for small organizations but lack the personalization and real-time benchmark integration that platforms like CompUp provide at scale. Static annual PDFs are low-cost but become outdated immediately; always-on self-service dashboards require HRIS integration but give employees year-round visibility into their total rewards.
As pay transparency regulations expand globally, total rewards communication will shift from annual compliance exercises to continuous employee engagement strategies, with real-time data and personalized benchmarking becoming table stakes for competitive employers. Organizations that invest in the right tools and processes today will be better positioned to attract and retain talent in an increasingly transparent compensation landscape.
Start by documenting your compensation philosophy using the framework above, then validate your benefits data before building your first statement. CompUp simplifies this entire process with automated data validation, pre-built templates, and real-time benchmarking that helps employees understand their full value from day one. Ready to transform how your organization communicates total rewards? Book a free demo to see how CompUp can help you close the comprehension gap and build a more transparent compensation culture.
A total rewards statement is a personalized summary showing an employee's full compensation value, base salary, bonuses, equity, benefits, retirement contributions, and perks. The Aon framework defines the standard components.
Annual distribution is most common, though organizations with frequently changing compensation may issue statements quarterly or monthly. At minimum, provide annual statements with self-service portal access for always-on visibility between formal updates.
No, small organizations can create statements manually using spreadsheets and PDF tools. Software becomes valuable at scale (100+ employees) for automation, personalization, and real-time data integration. The investment depends on employee count and update frequency.
Total compensation typically includes only cash and equity (base, bonus, stock), while total rewards adds benefits (health, retirement, time off) and perks (wellness programs, learning budgets). For deeper terminology clarification, see salary vs annual compensation.
Use three metrics: (1) comprehension surveys asking employees to estimate their total comp value, (2) engagement analytics tracking portal logins and time-on-page, (3) manager feedback on employee questions. Run a quarterly feedback-to-action loop to refine your approach.
Disclosure levels vary by organization and jurisdiction. Options range from benefits-only statements to pay band ranges to exact salaries. The choice depends on organizational culture, legal requirements, and your compensation philosophy transparency goals established in Step 1.
The top three pitfalls are (1) outdated data showing last year's benefits costs, (2) inconsistent messaging with different numbers in statements versus manager conversations, (3) lack of context, raw dollar amounts without market benchmarks or rationale.
Community Manager (Marketing)
As a Community Manager, I’m passionate about fostering collaboration and knowledge sharing among professionals in compensation management and total rewards. I develop engaging content that simplifies complex topics, empowering others to excel and aim to drive collective growth through insight and connection.
Revolutionizing Pay Strategies: Don't Miss Our Latest Blogs on Compensation Benchmarking