
compup
How to Price Jobs and Build Compensation Bands That Actually Hold Up
12 Nov 202610 min

How to Price Jobs and Build Compensation Bands That Actually Hold Up

A mispriced engineering role sits open for six months while your best internal performer leaves for a 15% bump elsewhere.

Compensation Management
Shradha Vadhone

Introduction

A mispriced engineering role sits open for six months while your best internal performer leaves for a 15% bump elsewhere. Both events cost more than the salary line item suggests. 50% of global organizations report difficulty retaining their best talent, and unstructured pay is usually at the center of that storm. Building compensation bands is the structural play that connects your talent strategy to real dollar decisions every single time a manager asks, 'What can we offer?'

Most teams treat band construction as an annual fire drill that starts with a survey dump and ends with a thousand one-off exceptions. That approach produces pay inequity you will litigate three years later and budget leakage no one catches until the board asks why your people costs grew 22% while headcount barely moved.

There is a shorter path. SeatGeek's Director of Compensation built pay bands in two days using systematic market pricing, compared to a month-long manual process. This guide takes you from compensation philosophy through geographic adjustments to a finalized, communicable band structure. By the end, you will have a repeatable methodology that scales whether you are pricing five jobs or five thousand.

Key Takeaways

Systematic band construction replaces reactive offer decisions with a defensible framework that protects both budget integrity and pay equity. Here are the central lessons:
  • Compensation philosophy precedes benchmarking: Your target market percentile and pay mix are talent strategy decisions, not survey outcomes.
  • Job architecture creates the skeleton: Standardized families and levels make every role mappable to market data.
  • Blend multiple data sources: No single survey tells the full story. Weight purchased, crowdsourced, and government data appropriately.
  • Match on scope, not titles: Two 'Senior Managers' in different industries may represent vastly different work.
  • Range spreads widen with seniority: Higher-level roles carry broader bands to accommodate performance and tenure variance.
  • Compa-ratios surface inequity: Ratios below 0.80 or above 1.20 demand investigation before they become systemic problems.

Step 1: Establish Your Compensation Philosophy and Market Position

Illustration for Step 1: Establish Your Compensation Philosophy and Market Position

Before you open a single survey, you need a documented position on how your organization intends to compete for talent. Here are the foundational decisions to codify:

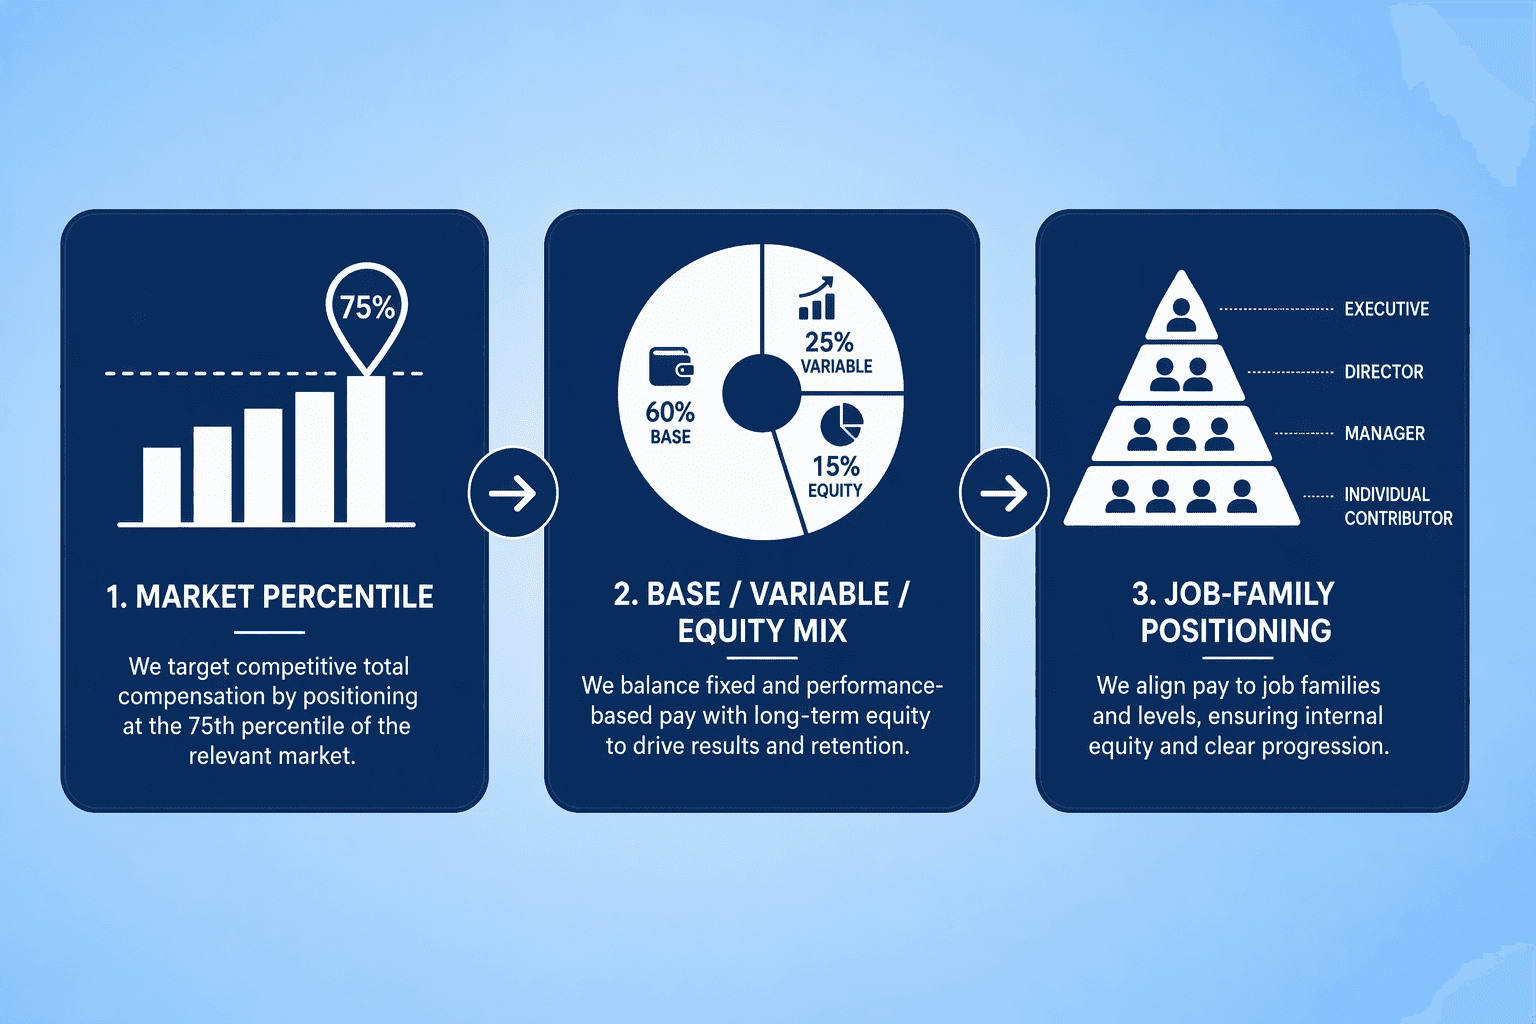
  1. Target market percentile: Choose where you want to land against the market for base salary and total cash. A growth-stage SaaS company might target the 65th percentile for engineering roles while anchoring back-office functions at the 50th.
  2. Base, variable, and equity mix: Define the split for each job family. A sales compensation structure may run 70/30 base-to-variable, while an R&D role leans heavier on equity.
  3. Comparator set: Name the industry, size, and stage peers you benchmark against. This prevents the drift that happens when a hiring manager pulls one-off data from a company triple your revenue.
  4. Pay rationale: State why you pay where you pay. Is your strategy to lead the market, match it, or lag while offsetting with equity upside? Write it down.
  5. Governance: Identify who owns the philosophy, who approves exceptions, and under what conditions the philosophy can be revisited.

Pay bands built around job levels keep offers consistent across locations. Midpoint differentials between adjacent bands typically run 10 to 15%, and band widths fall between 30 and 50%. These guardrails stop a hot market from pulling one new hire well past a tenured employee in the same role.

You also decide which geographic differentials matter. Some companies pay a San Francisco premium across all remote roles; others bench everything to a national median and apply local adjustments. Either path works as long as it's written down before the first exception request lands on your desk.

The comparator set deserves real discipline. A Series B startup of 200 people does not benchmark against a public company with 10,000 employees. Pick 8 to 12 peers that match your stage, talent market, and revenue band, and revisit the list once a year.

Step 2: Build a Standardized Job Architecture

A job architecture is the structural backbone that makes consistent pricing possible across every department. Without it, you are benchmarking a 'Data Scientist' in marketing against a 'Data Scientist' in product who operates two levels higher but shares the same title on paper. The gap is real, and it shows up in every attrition report.

Start by grouping roles into job families based on function: Engineering, Product, Sales, Marketing, G&A. Within each family, define career levels using distinct criteria around scope, autonomy, problem complexity, and business impact. A Level 3 Engineer might own a component; a Level 5 Engineer owns a system's architecture and mentors multiple teams. These definitions drive every market match you will make downstream.

CompUp's compensation management platform can help you map and maintain this architecture as your org evolves. The output is a level-to-job mapping that every hiring manager and recruiter uses as the single source of truth, eliminating the title inflation that quietly erodes your bands from within.

Step 3: Source, Blend, and Validate Market Data

The quality of your bands depends entirely on the inputs. Build a data hierarchy before you start blending.

Data SourceStrengthsLimitationsIdeal Use Case
Purchased surveys (Radford, Mercer, Culpepper)Rigorous methodology, reliable cuts by industry and sizeCostly, limited to participating firmsCore benchmarking for standard roles
Crowdsourced platforms (Pave Market Data Pro)Real-time data from 8,000+ companies, predictive machine learningSelf-reported, may skew toward tech and funded startupsQuick validation and trend-spotting
Government data (BLS OEWS)Free, broad coverage across all sectors and regionsDated, lacks equity and detailed levelingSanity checks and geographic reference points

Weight your sources by relevance. Assign more weight to a purchased survey that mirrors your industry and revenue band, and use Pave's Market Data Lite tier for companies with 1 to 200 employees as a secondary signal. When datasets conflict, investigate outliers rather than averaging blindly. A single $400,000 data point in a job family averaging $160,000 should be investigated, not blended.
Step 4: Benchmark Jobs by Matching and Slotting

Illustration for Step 4: Benchmark Jobs by Matching and Slotting

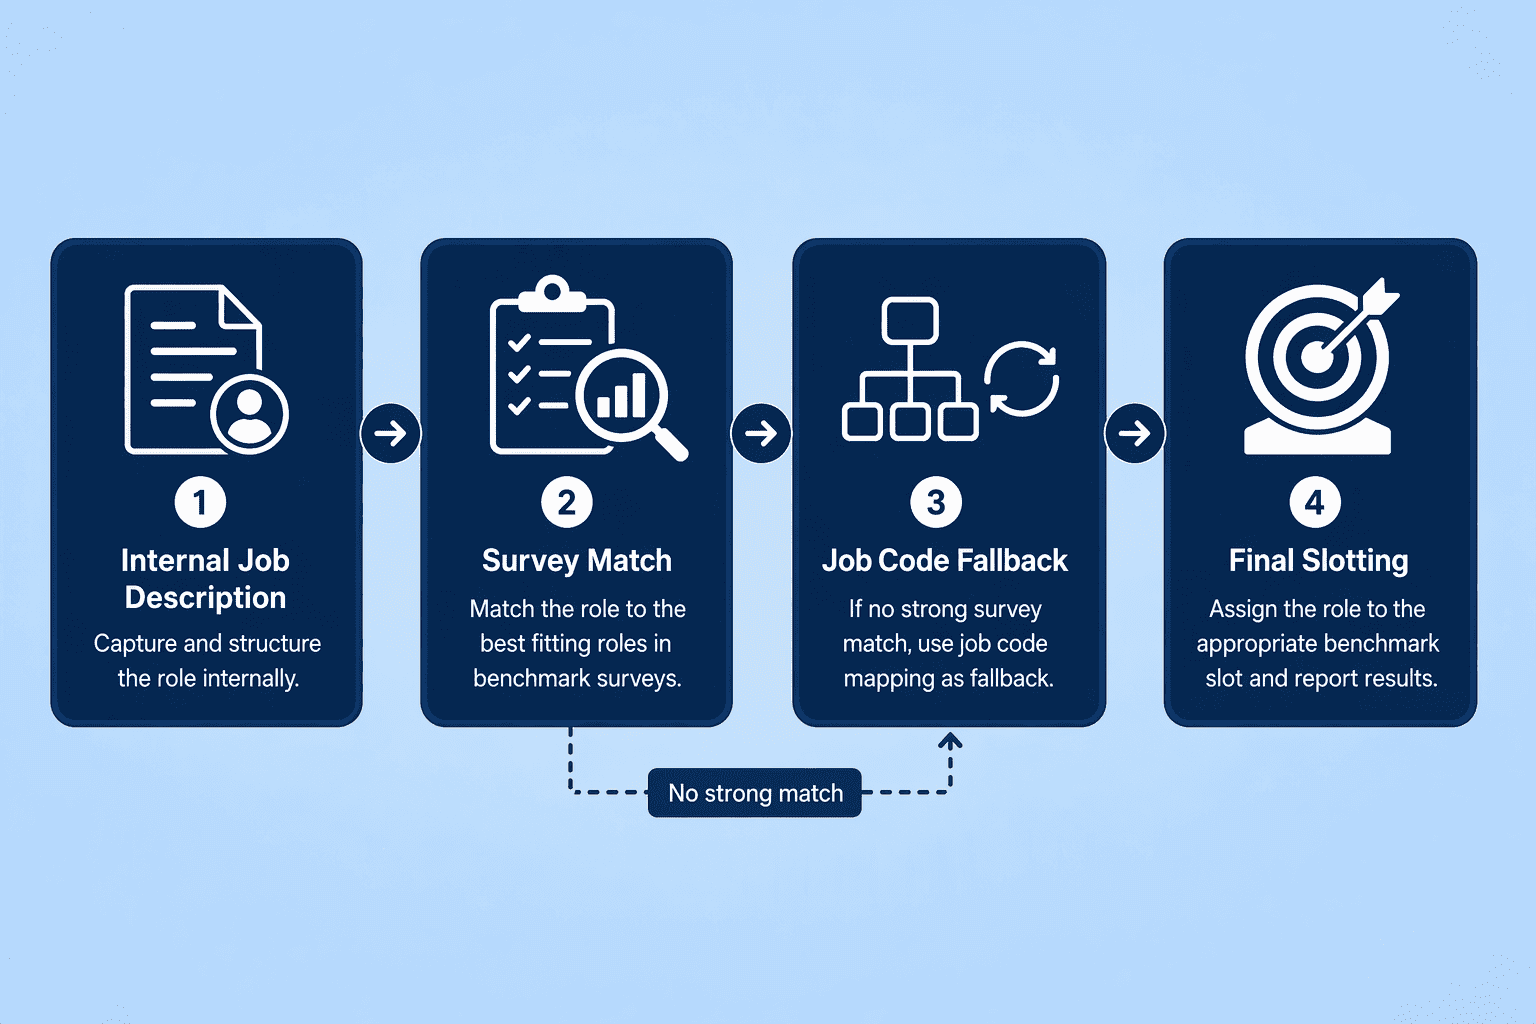
Salary bands group roles based on scope, responsibility, and required skills, not just job titles. Matching on title alone is the most common and costly error in market pricing. Follow this matching sequence to get it right:
  1. Start with the job summary, not the title: Read the survey's description of duties, level, and scope. Compare it to your internal job description paragraph by paragraph.
  2. Apply job code fallbacks for hybrid roles: When a role spans two disciplines, use market pricing software to apply survey and job code fallbacks rather than forcing a bad match.
  3. Match at the median level, then apply level progressions: Price the fully competent level first, then use market-derived progression multiples to extrapolate junior and senior tiers.
  4. Handle unique roles by composite matching: Break an unusual role into its core components, price each against the closest survey benchmark, and build a weighted composite.
  5. Document every match decision: Market pricing software should preserve the evidence behind the number, including the internal job, external match, source, scope, effective date, and reviewer decision.

Step 5: Calculate Midpoint, Range Spread, Minimum, and Maximum

Illustration for Step 5: Calculate Midpoint, Range Spread, Minimum, and Maximum

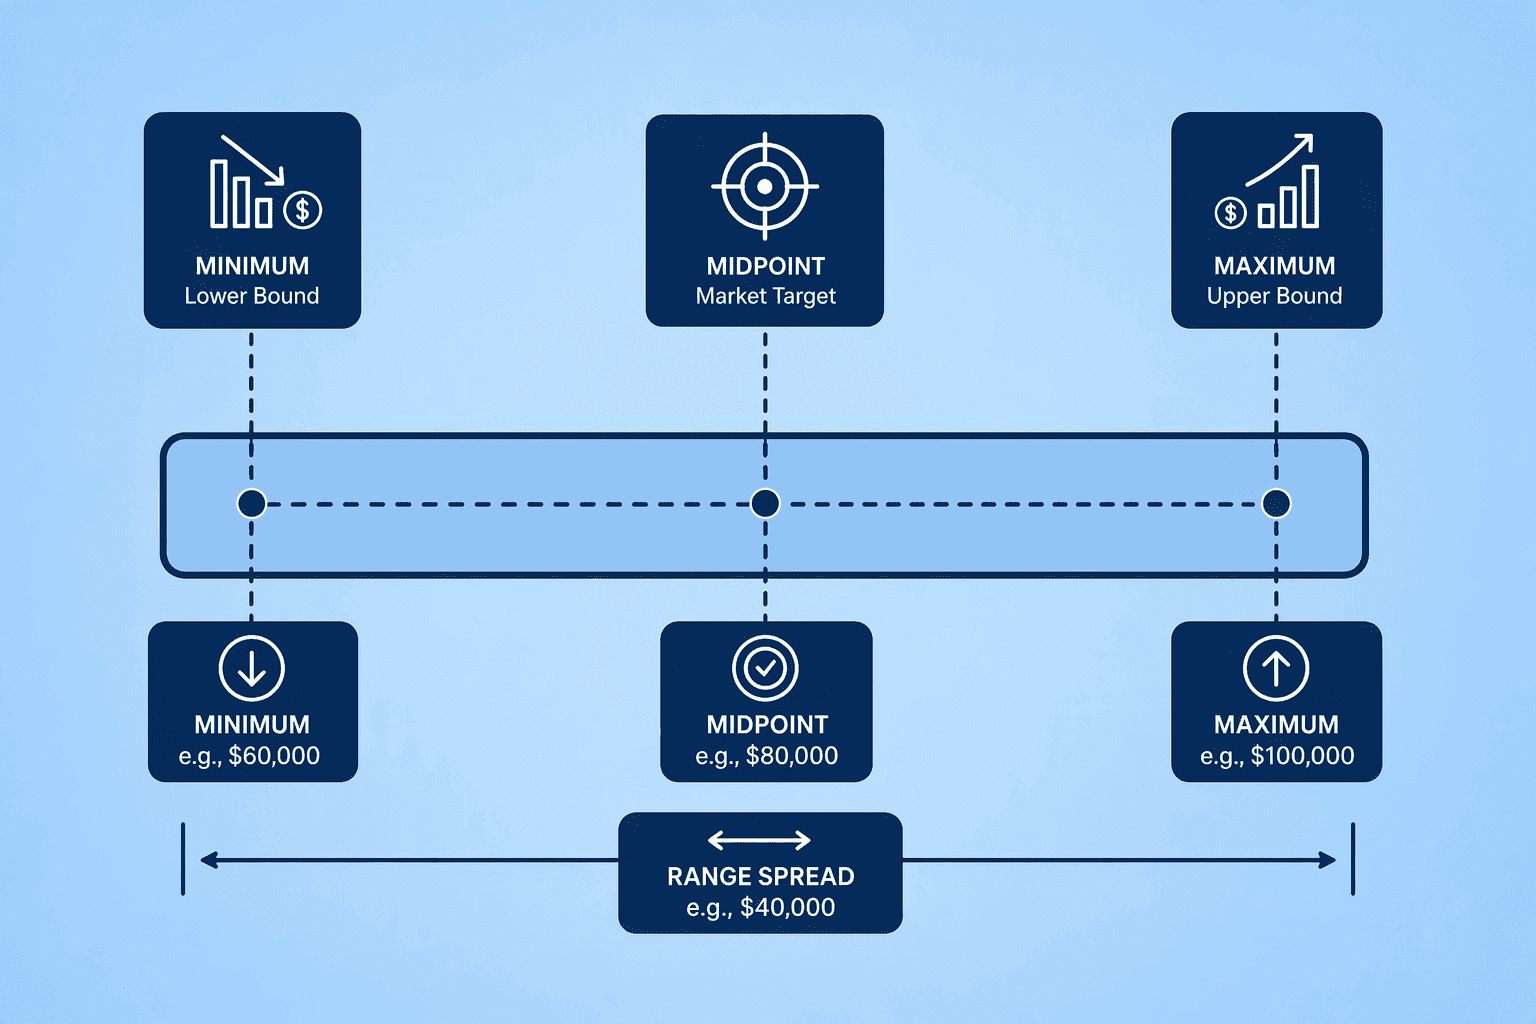
Your blended market data gives you a single reference point. That point becomes your midpoint. From there, build your bands by following these principles:
  • Define the midpoint: The midpoint is what you would pay a competent employee who is neither a beginner nor highly experienced http://workleap.com/blog/guide-to-building-pay-bands. It anchors everything.
  • Set range spreads by seniority: Range spread determines how far your minimum and maximum stretch from that midpoint. Spreads are never uniform. Entry-level roles might use a 30% spread (min at 85% of midpoint, max at 115%). Director-level roles often require a 50% spread, and executive bands can reach 60% or more. Senior roles carry wider performance variance and longer tenure curves. The band needs room for outstanding years without forcing an off-cycle promotion.
  • Calculate mechanically: Minimum equals midpoint divided by (1 plus half the range spread). Maximum equals minimum multiplied by (1 plus the range spread). For a $100,000 midpoint with a 40% spread, that yields a minimum of roughly $83,300 and a maximum of $116,700. Document the formula and lock it into your compensation planning tool so it applies consistently.
  • Avoid common failure points: Building bands from a single averaged number and slapping arbitrary spreads on top. Your salary bands might have some overlap, and that is OK. What matters is that each higher pay band has a clearly higher midpoint, reflecting increased scope and responsibility. Overlap between adjacent levels is normal. Flat or inverted midpoints between levels signal a broken architecture.

Step 6: Apply Geographic Pay Differentials

Illustration for Step 6: Apply Geographic Pay Differentials

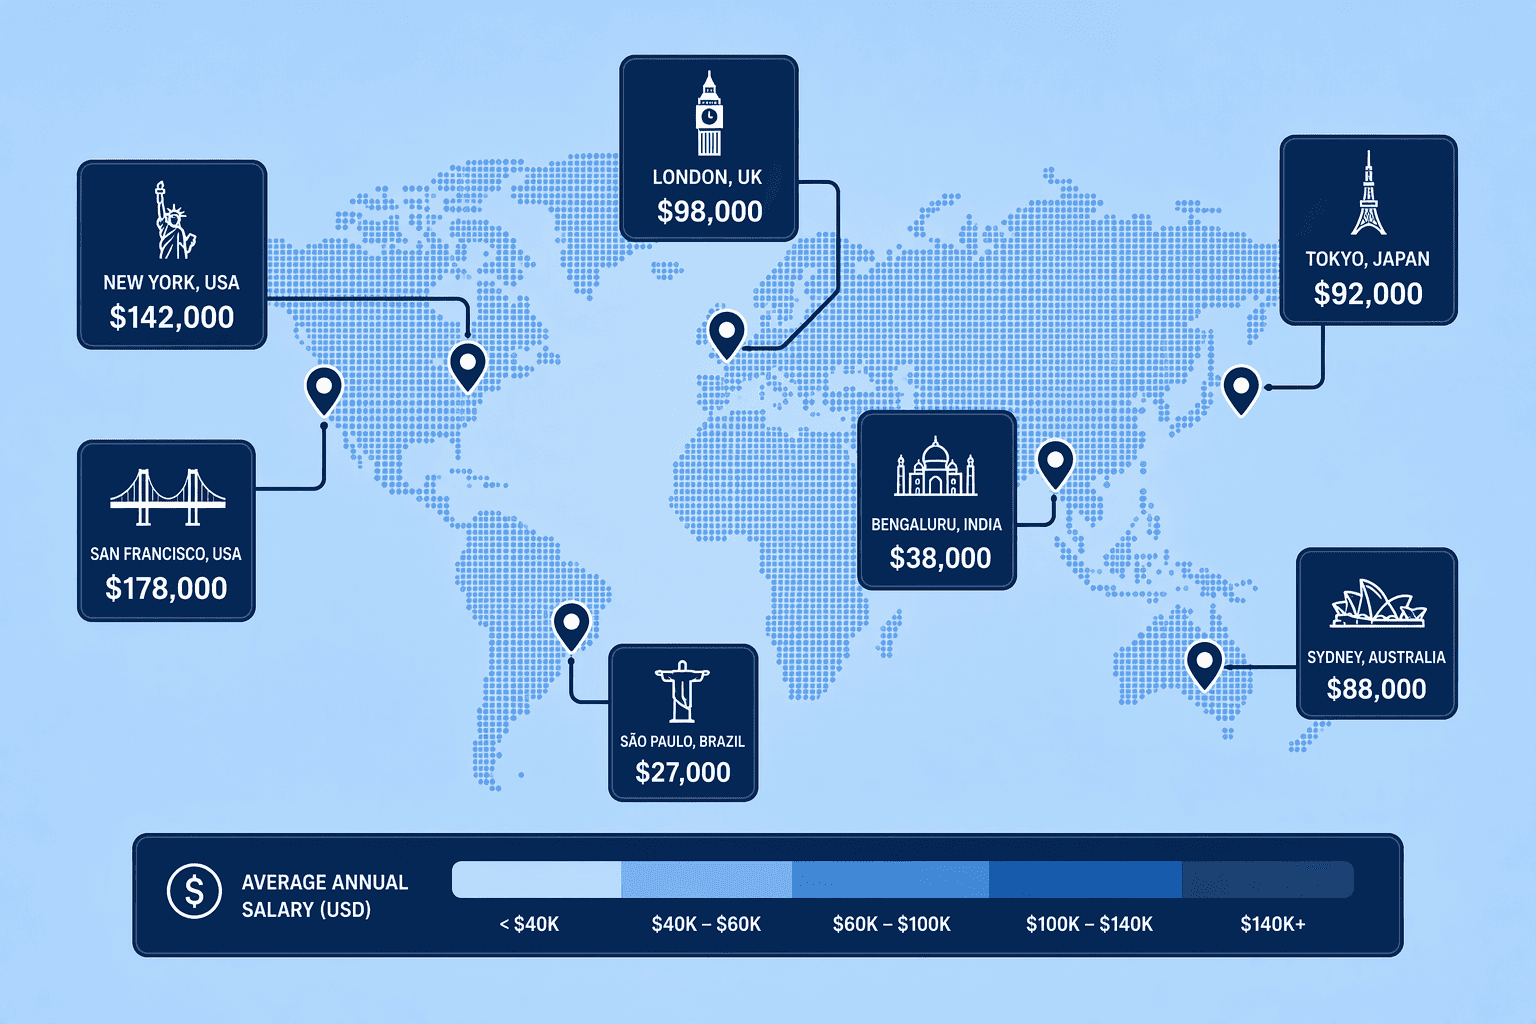
Yvonne Liu, Sr. Manager of Compensation at Clio, reported that the real-time nature and relevancy of Pave's data cut instills deep trust from Clio's leadership team, partly because that data can be sliced to the right geographic level. For distributed workforces, geography is a first-order pricing dimension. Location-based pay compensates employees based on their own locations, accounting for variances in cost of living and market competitiveness. There are three dominant models:

  • National structure with metro differentials: Use a single set of bands with metro-based differentials applied as a percentage on top. A software engineer role priced at the national midpoint of $140,000 might carry a 1.15x adjustment for the San Francisco Bay Area and a 0.90x adjustment for a lower-cost metro. The differential is applied to the band reference, and the employee's actual pay sits inside that local band.
  • Separate band structures per metro: Build distinct band structures for each metro area or zone from the start. This works for large organizations concentrated in a few cities.
  • Use cost-of-labor data: The critical rule is to use cost of labor data, not cost of living. For remote and hybrid teams, that may mean benchmarking against multiple geographic markets. Cost of living tells you that housing in Austin is cheaper than in San Francisco. Cost of labor tells you what employers in Austin are actually paying for the same talent. That is the number your bands need.

Step 7: Model Compa-Ratios and Assess Internal Equity

A compa-ratio is simply an employee's salary divided by the midpoint of their band. An employee at $105,000 against a $100,000 midpoint has a 1.05 compa-ratio. That single number surfaces more problems faster than any dashboard. Pay equity is the practice of ensuring that employees are compensated fairly for substantially similar work after accounting for legitimate, job-related factors such as role and level, scope of responsibility, location, relevant experience, and performance. Use it to:
  • Plot compa-ratios by demographic groups: Analyze by gender, race, and tenure cohort. Flag any group where the median ratio deviates by more than 0.05 from the population median.
  • Flag extreme outliers: Identify individual ratios below 0.80 or above 1.20 and investigate them before they show up in an attorney's letter.
  • Remediate with documented rationale: Remediation is not about perfect flatness. It is about documented, defensible explanations. A senior engineer with a 1.15 compa-ratio because of niche expertise is fine. A junior analyst with a 0.78 because their starting offer was never adjusted to the band minimum is not.

Step 8: Maintain, Update, and Communicate Compensation Bands

Illustration for Step 8: Maintain, Update, and Communicate Compensation Bands

Bands rot. Market data ages in months, not years. Manage your band lifecycle with these practices:

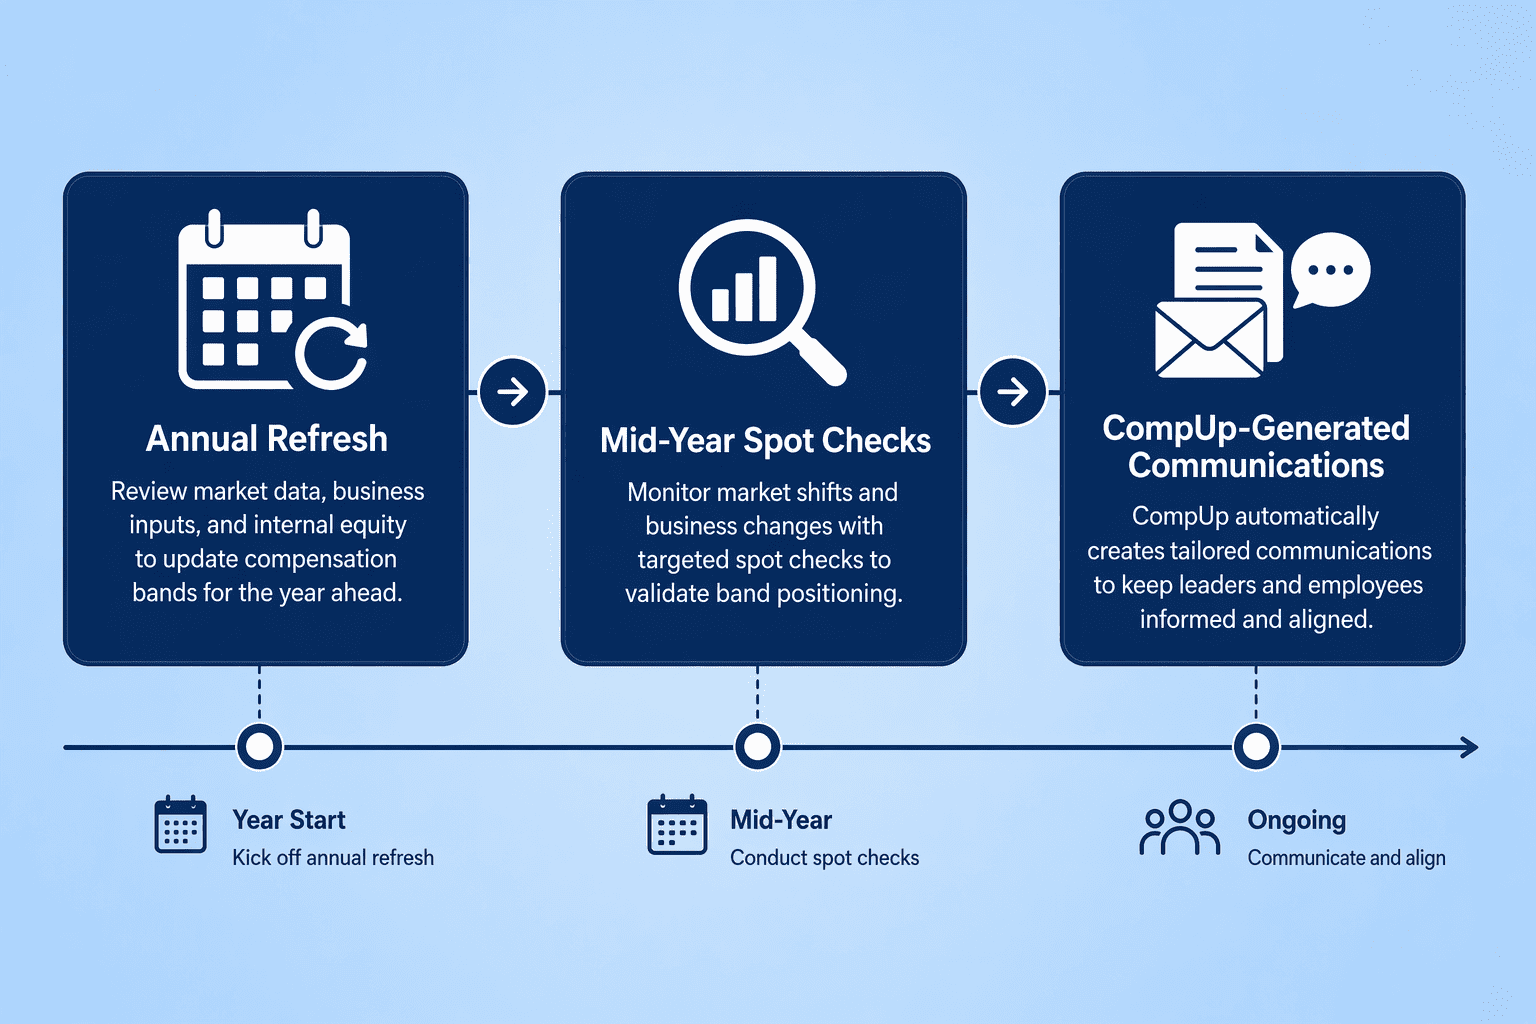
  • Set a formal refresh cadence: Tie it to your compensation cycle. For most organizations, an annual full refresh with a mid-year spot check on high-churn roles strikes the right balance. When new survey data releases, feed it into your pricing model and flag any role where the market midpoint has shifted more than 5%.
  • Communicate changes effectively: CompUp can automatically generate personalized Total Rewards Statements at the close of the appraisal cycle, transforming opaque compensation decisions into an employee-facing document that shows base, variable, equity, and benefits in one view. Communication is the step most compensation teams skip, and it is the one that determines whether your architecture is trusted or resented. Give managers a short script: what changed, why it changed, and where to find their own total rewards statement.
  • Build a communication loop: The most effective communication loop is short. Neil Pfeiffer, Sr. Manager of Compensation at Workato, freed up seven weeks of time for pre-planning with business partners, leaders, and managers, and finished key consultations two months earlier. That pre-work meant managers reached the compensation cycle already informed. Office hours dropped. Trust increased.

Conclusion

Systematic band construction replaces the reactive cycle of one-off offers and belated equity patches with a framework that scales. It protects pay equity, tightens budget forecasting, and makes manager compensation conversations shorter and more honest.

Market data shifts constantly. Your bands have to keep pace. That means a disciplined refresh cadence, cross-referenced against multiple data sources, and a willingness to adjust when the evidence says you are off.

Build the architecture now. Every future pricing decision becomes faster, cleaner, and more defensible. If you're weighing options, CompUp is worth a closer look.

Frequently Asked Questions

How do I build a salary compensation band from market data?

Blend purchased surveys, crowdsourced platforms, and government data to establish a market midpoint for each role. Apply a range spread that widens with seniority. Calculate minimum as midpoint divided by (1 + half the spread), maximum as minimum multiplied by (1 + the spread). Document every assumption.

What are the best methods for pricing a new job role in 2026?

Match on scope and responsibilities, not the title. Use a composite match for hybrid roles by pricing core components against the closest survey benchmarks. Apply job code fallbacks and level progressions where a direct match is unavailable, and validate with at least two independent data sources.

How do I ensure internal pay equity while staying competitive with the market?

Calculate compa-ratios for every employee and analyze distribution by gender, race, and tenure. Investigate ratios below 0.80 or above 1.20. Remediate gaps with documented, job-related rationale. Run this analysis annually and tie it to your compensation cycle governance.

What are the key differences between base salary, total cash, and total rewards when building pay ranges?

Base salary is fixed annual pay. Total cash adds variable compensation like bonuses and commissions. Total rewards encompasses base, variable, equity, and benefits. Your band structure must clarify which of these the midpoint, minimum, and maximum references apply to.

What data sources and tools should I use for compensation benchmarking in the US?

Use purchased surveys like Radford or Mercer for rigorous cuts by industry and size. Supplement with real-time platforms like Pave Market Data Pro and cross-check against BLS OEWS data. CompUp provides industry-specific compensation data integrated with your bands.

How do I communicate compensation structures and pay raise decisions to employees transparently?

Provide every employee a personalized total rewards statement at the close of the cycle. Give managers a short script covering what changed, why, and where to find their own data. Pre-planning with business leaders before the cycle, as Workato did, reduces manager office hours and builds trust.

Sources

  1. Price Jobs & Build Compensation Bands | Pave - www.pave.com
  2. Price Jobs & Build Compensation Bands | Pave - pave.com
  3. How to build compensation bands that help you make consistent pay decisions - ravio.com
  4. Pay Bands: How to Build Them Step by Step | Workleap | Workleap - workleap.com
  5. 10 Best Compensation Market Pricing Software Platforms (2026) - compbldr.ai
  6. How to Conduct a Pay Equity Analysis | Workday US - www.workday.com
Tags:
Share:

Shradha Vadhone
Shradha Vadhone

Community Manager (Marketing)

As a Community Manager, I’m passionate about fostering collaboration and knowledge sharing among professionals in compensation management and total rewards. I develop engaging content that simplifies complex topics, empowering others to excel and aim to drive collective growth through insight and connection.


Our Latest Posts

Revolutionizing Pay Strategies: Don't Miss Our Latest Blogs on Compensation Benchmarking

View All
Ready to Get Started?
HiresureLogo
ApicaSocLogoISOCertifiedGDPRLogo