
Your CHRO emails you at 9 PM: a comp statement sent to a Director in France listed their salary in US dollars and missed $15,000 in local allowances. Meanwhile, a high-potential engineer on your team is interviewing elsewhere, convinced her compensation lags the market because she cannot see the $40,000 in employer-paid benefits, equity acceleration, and development stipends sitting inside a static PDF she never opened. 49% of millennials and Gen Z plan to leave their jobs within two years for reasons primarily related to compensation.
Those employees are not ungrateful. They are uninformed. Most organizations treat the annual benefit statement as a compliance artifact. It lands once a year, dense with jargon, anchored to a single cash figure, and asks the employee to do the math on value that should feel visceral. A massive gap opens between what you spend and what your people perceive.
This article diagnoses why the standard delivery model breaks comprehension and walks you through a fixable framework. We will examine the psychological biases that blind employees to non-cash rewards, the design failures that overload them, and the operational blueprint that turns invisible compensation into a visible retention engine.
Before we unpack the mechanics, here is what the research forces every rewards leader to confront:
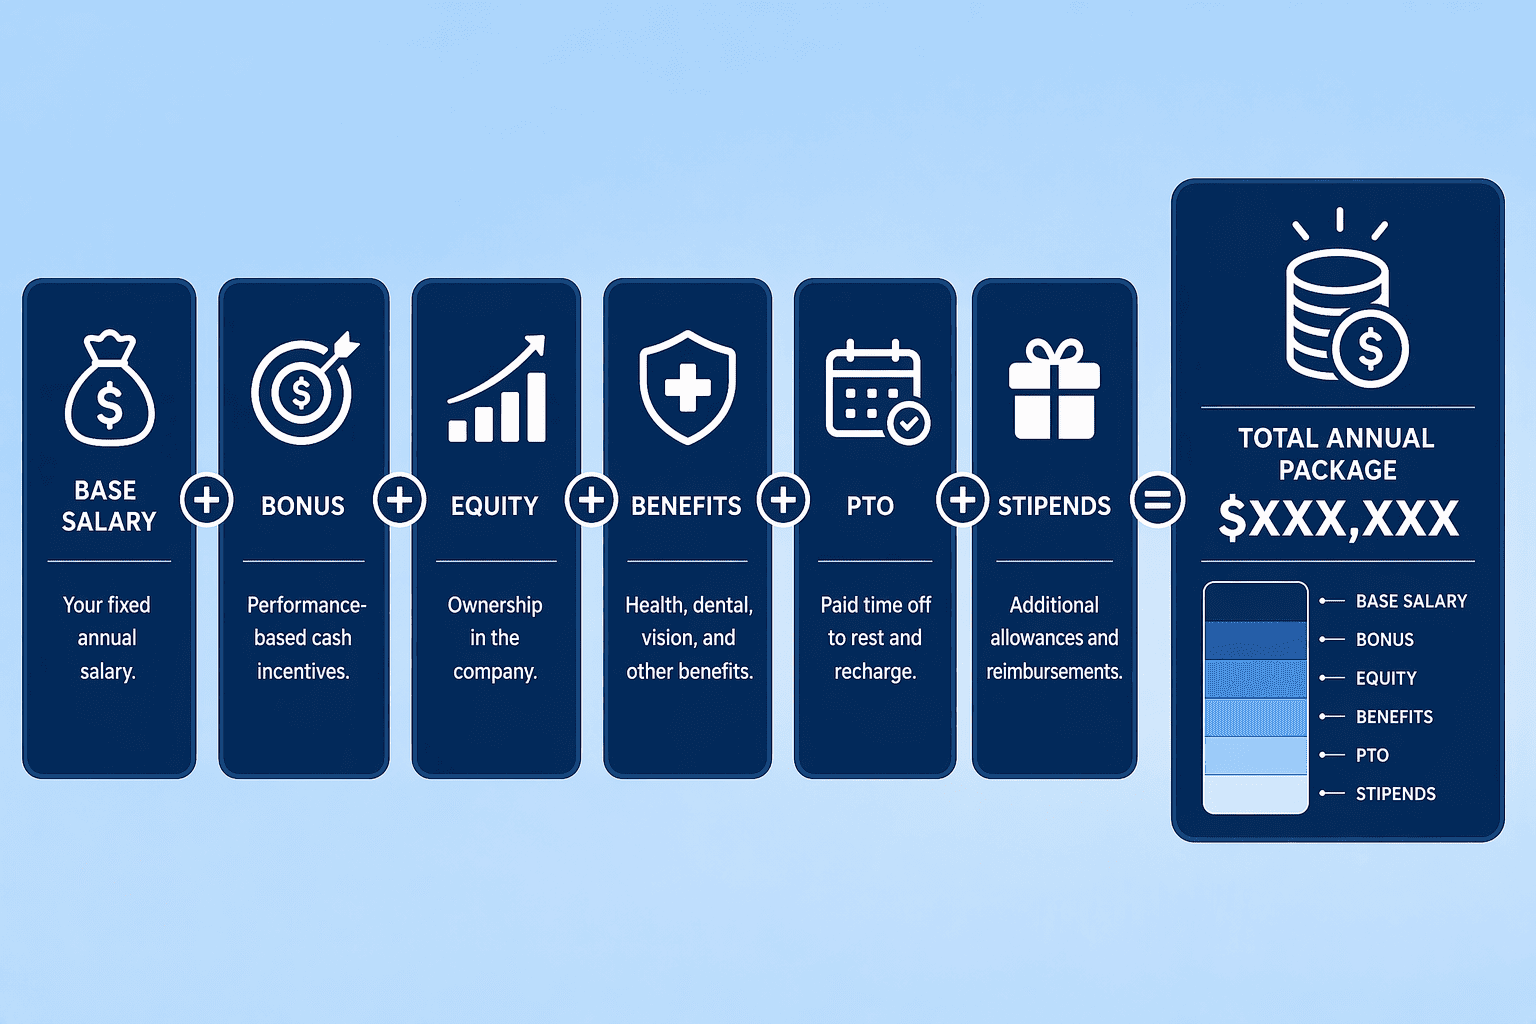
Total compensation is the full economic exchange between employer and employee. It spans base salary, variable pay including bonuses and commissions, employer contributions to health and retirement plans, the projected and realized value of equity grants, paid time off, stipends, professional development funding, and often less-visible items like life and disability insurance premiums. When you stack these components, a $120,000 salary frequently becomes a $170,000-plus total package. The problem begins at the statement level. Most organizations extract a payroll summary from their HRIS, wrap it in a PDF, and call the job done.
What gets dropped in that extraction is everything that does not appear as a line item on a cash register. Employer 401(k) match, the market value of RSUs, and the premiums funding health coverage vanish. The employee receives a document that represents perhaps 60 percent of their actual economic relationship with the company.
The scope gap is an administrative oversight and a structural miscommunication. Every retention conversation starts from a deficit position because your largest people investments stay untracked and unappreciated.
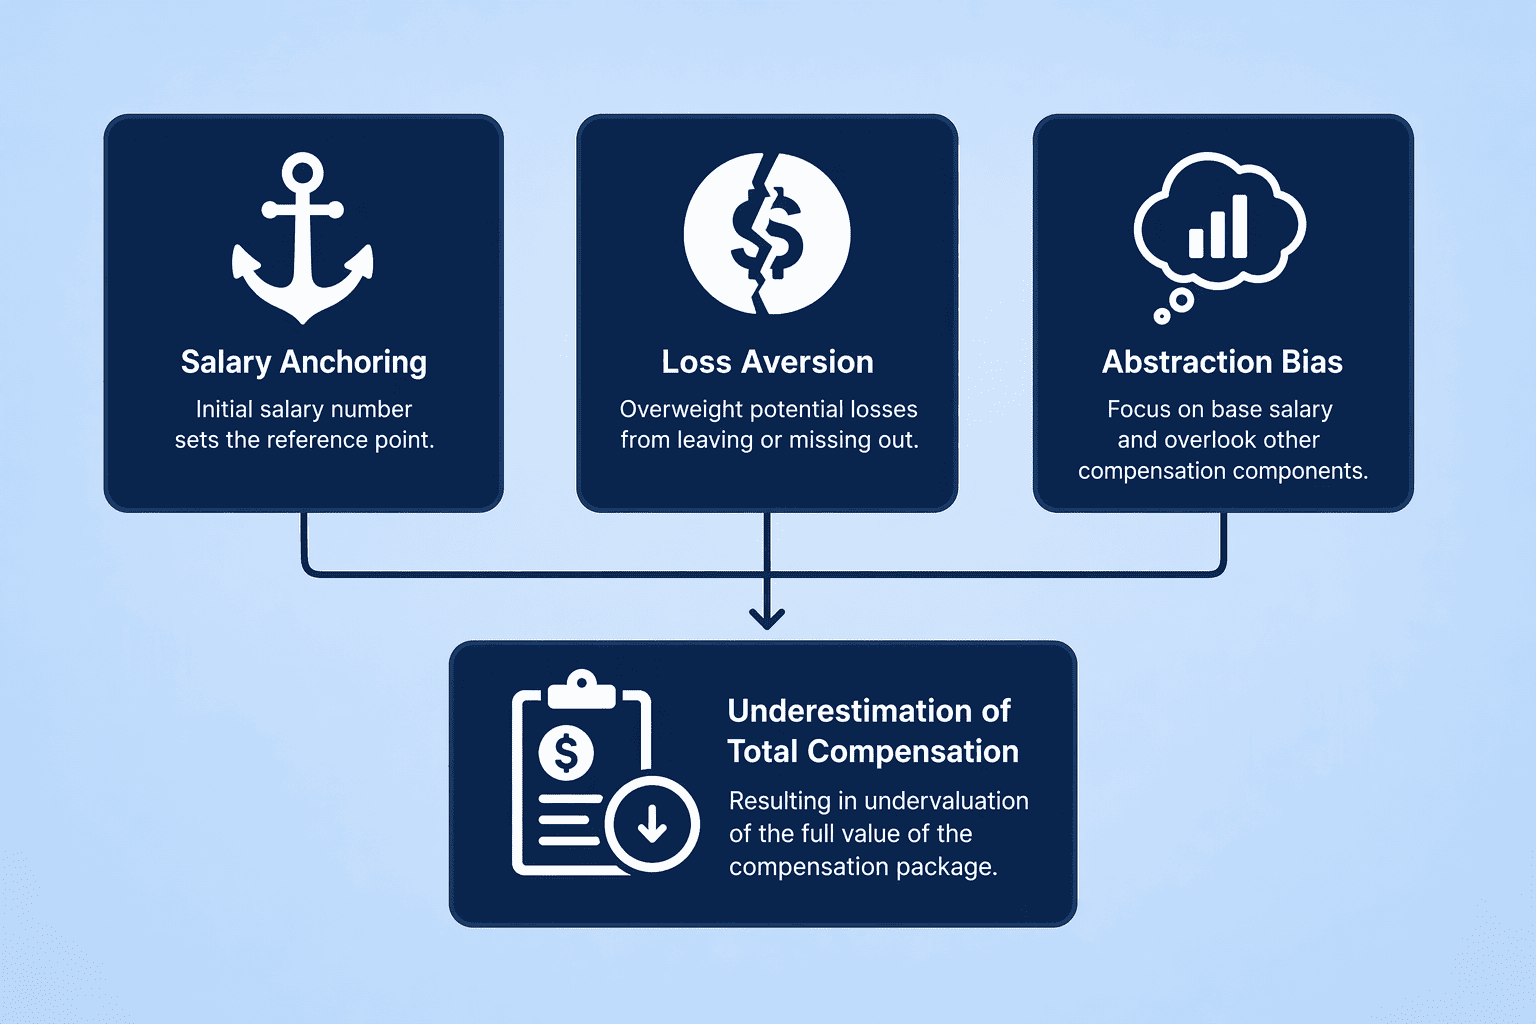
Employees do not process compensation as a spreadsheet. They process it as a story, and the brain filters that story through predictable biases. Understanding those biases turns a seemingly irrational problem into one you can design around.
| Cognitive Bias | How It Distorts Compensation Perception | Operational Consequence |
|---|---|---|
| Salary Anchoring | Employees lock onto the base salary figure because it is the most frequent, concrete, and easily comparable number they see, treating every other component as a footnote. | Equity grants, employer insurance premiums, and 401(k) matches are mentally discounted to near-zero in personal value calculations. |
| Present Bias | Immediate, tangible rewards dominate decision-making, while deferred compensation such as vesting schedules and retirement contributions feels abstract and undervalued. | Employees over-weight a $5,000 salary bump today against a $20,000 equity grant that vests over four years, even when the grant is worth more. |
| Information Overload | Dense tables, actuarial language, and compliance-driven terminology exceed cognitive bandwidth, triggering disengagement rather than appreciation. | Statements go unread; the employer spend they document becomes invisible, eroding the perceived value proposition. |
| Loss Aversion | Employees reference their current cash compensation as a baseline and frame any perceived shortfall against visible market benchmarks as a loss. | Job offers emphasizing base salary alone exploit this effect, even when the total package comparison favors the current employer. |
A benefits statement that ignores these biases actively works against your retention goals. The fix lies in structural redesign, not in nudging employees to read more carefully.
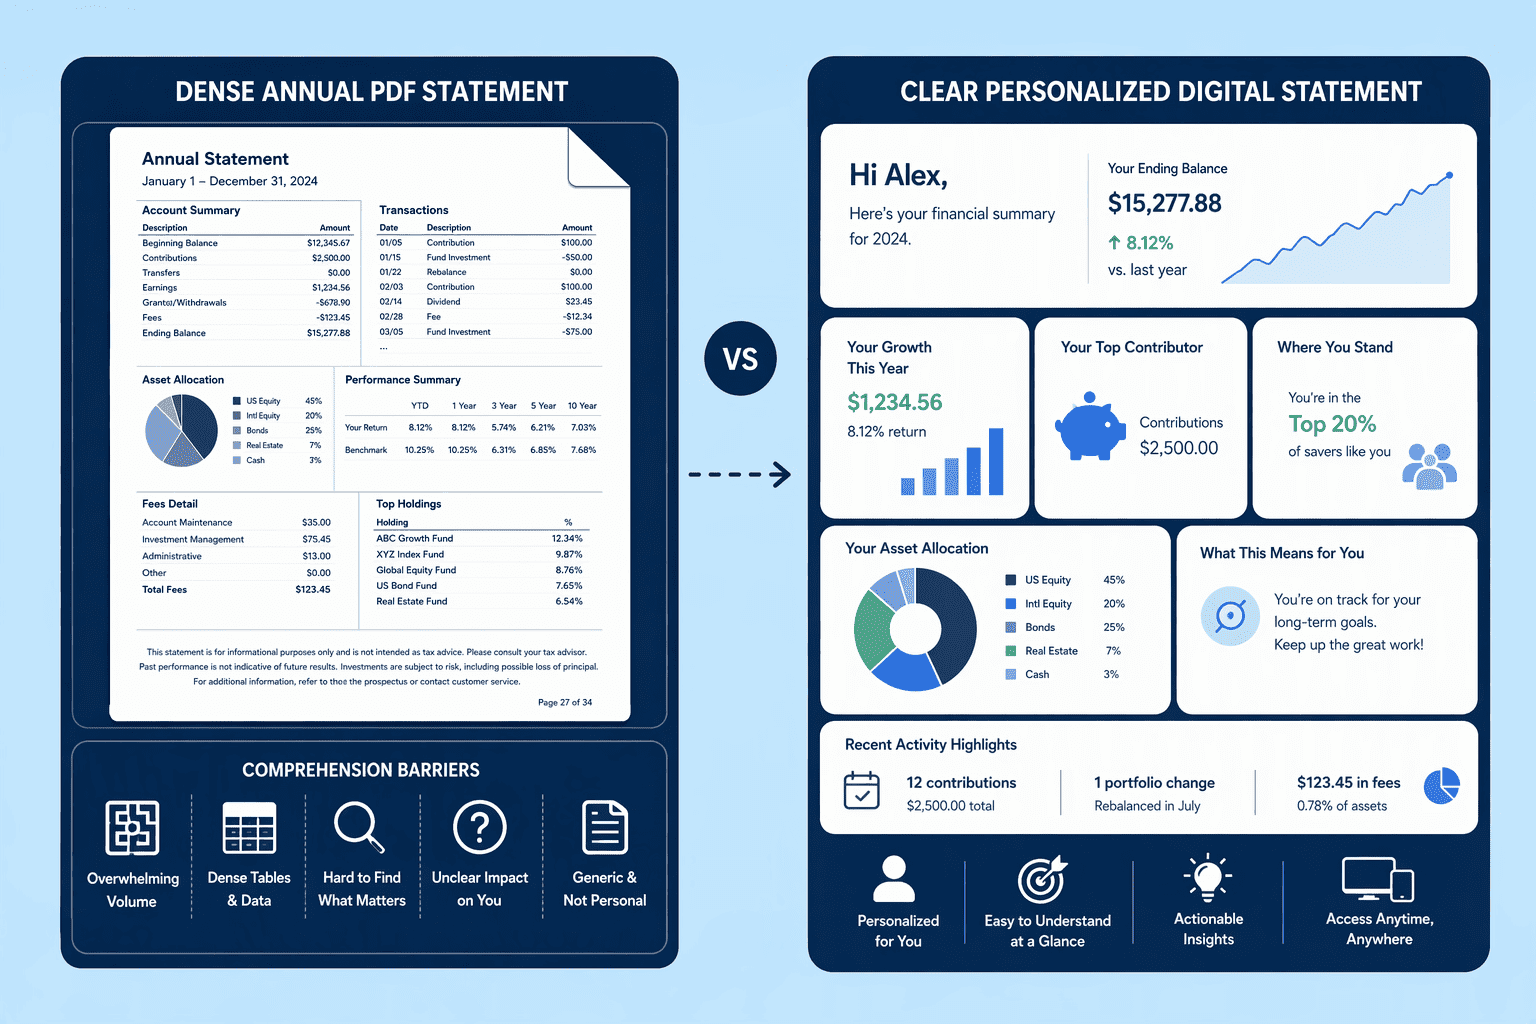
Eighty-nine percent of HR professionals are prioritizing total rewards improvements according to industry data, yet the dominant delivery mechanism remains the static annual PDF. The format itself causes the comprehension failure. A document arriving once every twelve months, packed with actuarial terminology, formatted as dense data tables, and lacking any personalization beyond a name field violates everything we know about how working memory processes financial information.
The jargon problem is severe. Terms like "imputed income" and "benefit-eligible compensation" are administrative categories, not value signals. When an employee encounters them, the cognitive load spikes and attention drops. The employee does not work harder to parse the language; they scan down to the one number they do understand: base salary.
Mobile consumption compounds the issue. A complex PDF statement rendered on a phone screen is functionally unreadable. If your workforce cannot access their total rewards while preparing for a compensation conversation or evaluating an external offer, the statement might as well not exist.
This failure belongs to channel strategy, not employee engagement. A once-yearly, desktop-bound, jargon-heavy document is designed for archival compliance, not retention. The 49 percent attrition intent figure is the evidence that the design is not working.
When rewards stay hidden, the business does not just lose goodwill. It absorbs a direct financial hit through preventable attrition, disengagement, and sunk benefit spend. Consider what that gap costs in operational terms:
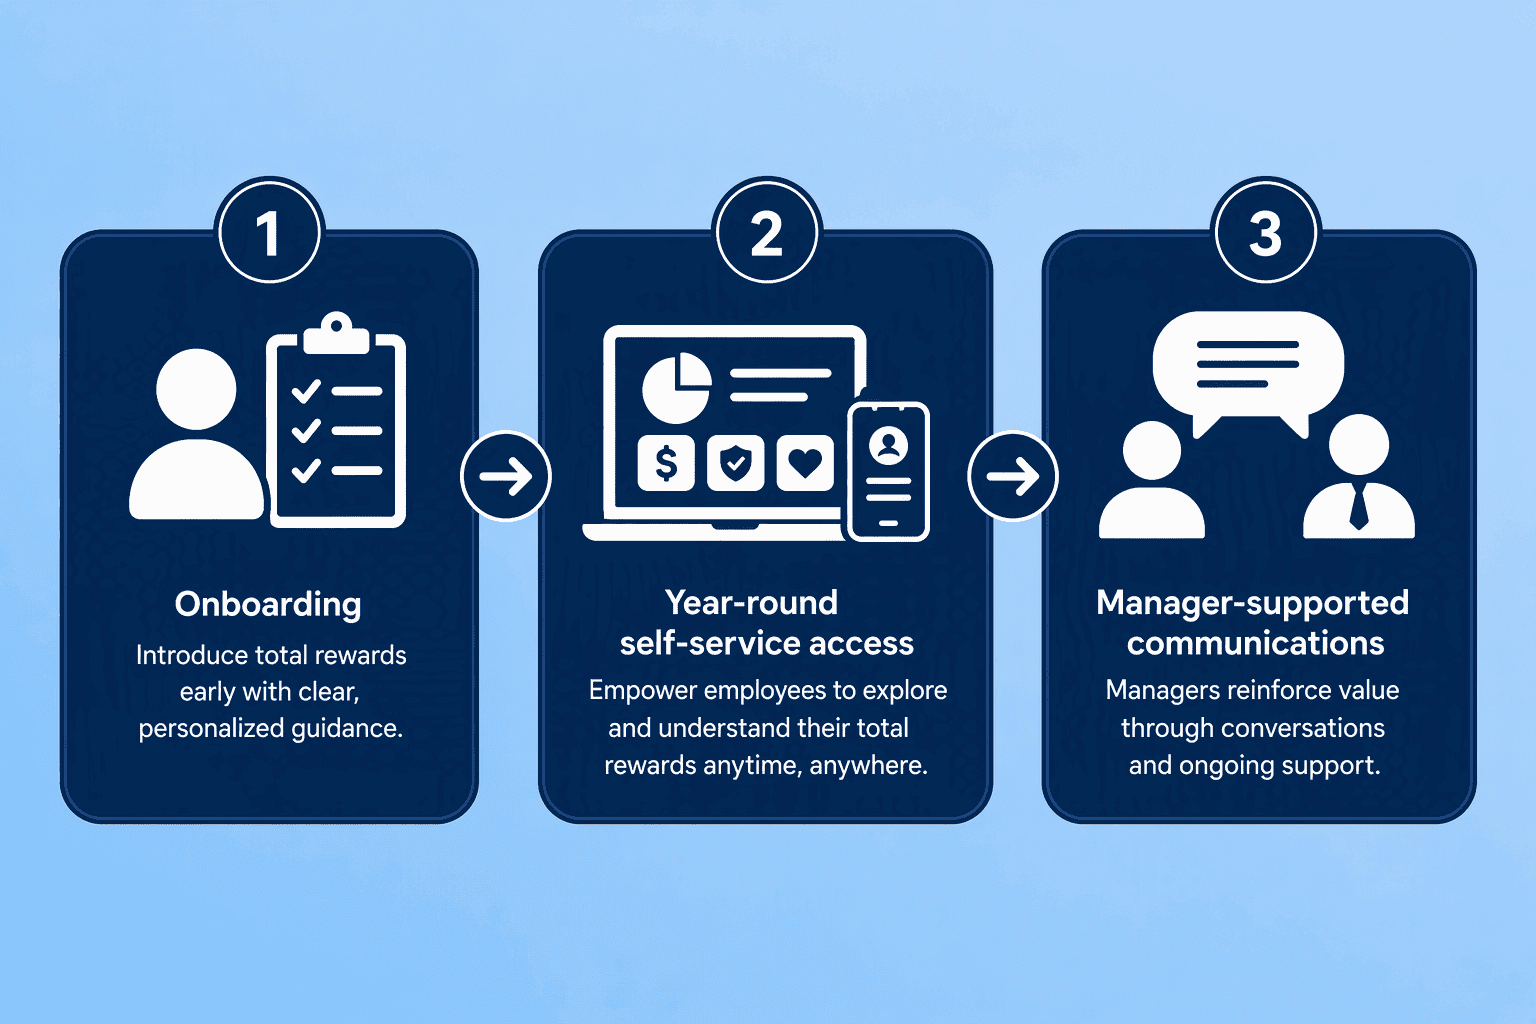
The solution starts long before you pick a platform. Every organization can take immediate steps to shift from an annual compliance dump to a continuous value signal.
Beyond the portal, give managers visibility into the full compensation picture for every direct report. When a manager can reference specific, current data on equity value, employer-paid premiums, and projected retirement contributions during a one-on-one, that reinforcement happens in the moments of highest attention. Combine this with year-over-year trending that shows cumulative investment over an employee's tenure. The narrative shifts from "here is a document you need to read" to "here is a growing investment we want you to see." That shift in framing changes how employees process the information.
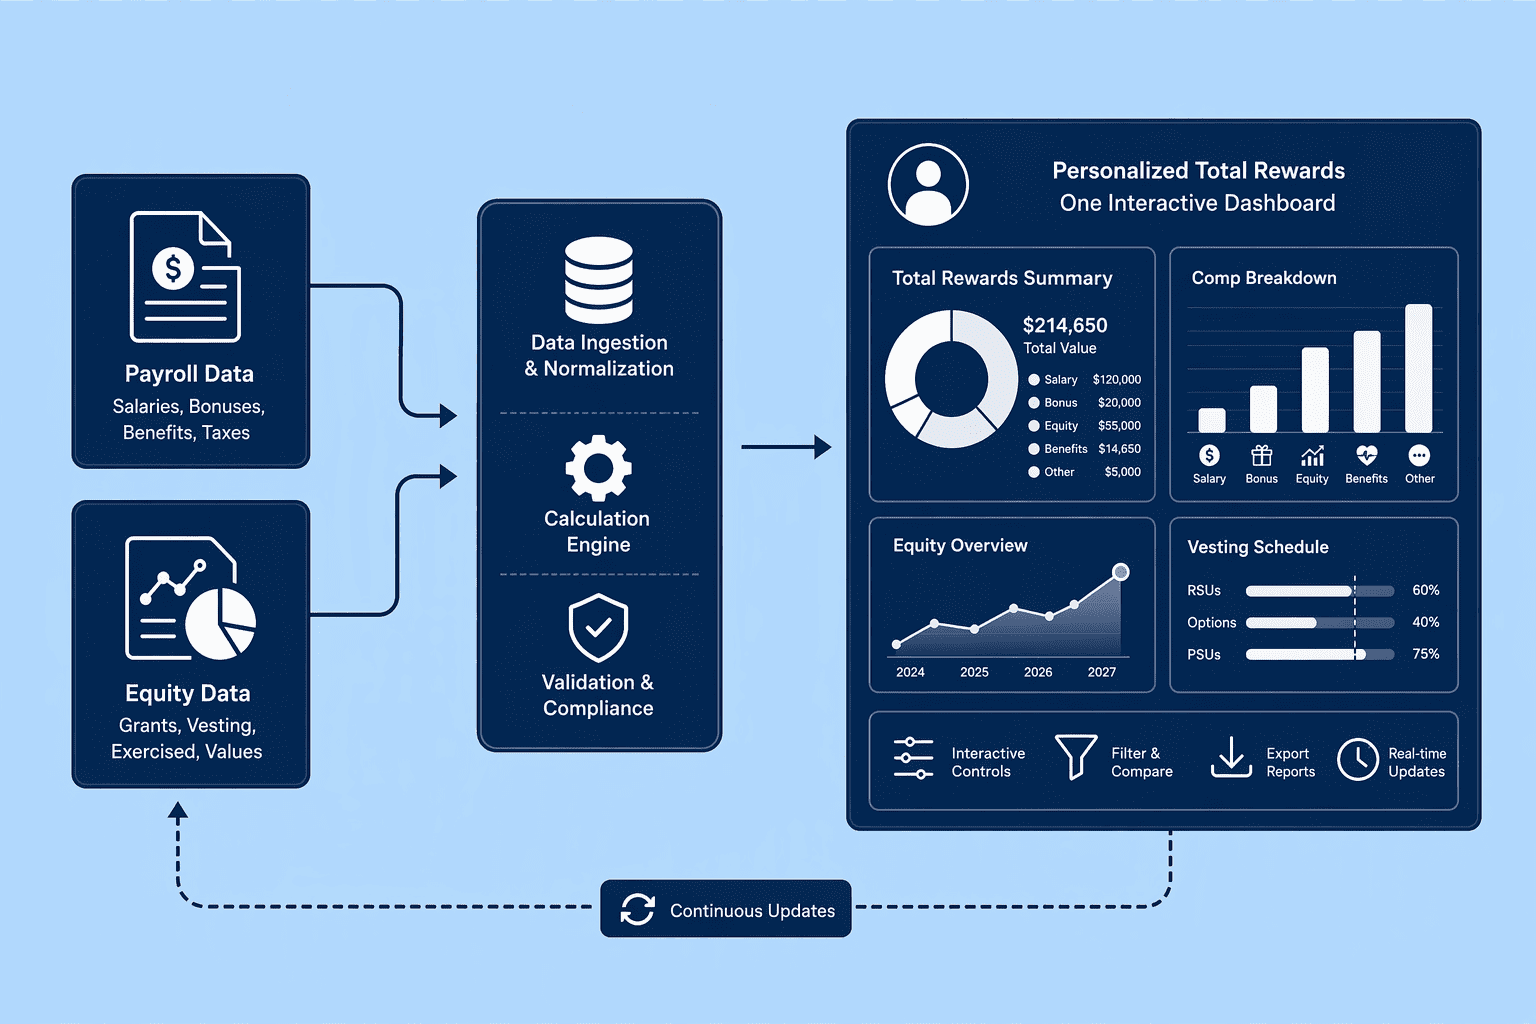
A purpose-built total compensation platform addresses the design failures at an architectural level rather than a cosmetic one. CompUp delivers personalized Total Rewards Statements automatically at the close of the appraisal cycle, pulling integrated payroll and equity data so the statement reflects base pay, bonus, commissions, employer contributions, and equity projections in one interactive view. This eliminates the manual spreadsheet risk that generates errors like the one in our opening scenario.
Because the platform renders year-over-year history, employees see cumulative investment rather than a single point in time. That longitudinal view directly counteracts present bias: the $80,000 in employer retirement contributions over five years becomes concrete in a way a single annual line item never could. Equity projections within the statement convert vesting schedules and grant values into projected worth, closing the knowledge gap that makes equity a confusing abstraction for so many recipients.
Manager visibility is built into the architecture. CompUp gives managers a clear picture of how each direct report is fully compensated, integrating with platforms like BambooHR, Lattice, Darwinbox, and Workable to ensure the data stays accurate without dual entry. That means the reinforcement of total value happens in the granular, high-trust conversations where managers can reference concrete figures.
CompUp is a compensation-specialized platform built around the premise that compensation perception is a continuous operational function, not an annual HR exercise. When the delivery mechanism matches the psychology, your spend stops being invisible and starts acting as the retention asset it was always meant to be.
When 49 percent of employees are ready to quit over pay, the natural instinct is to re-examine the numbers on the check. That instinct misses what the data actually says. The 49 percent attrition figure reflects a visibility gap, not a spending gap. Half your emerging workforce is willing to walk even though employer investments routinely outstrip their perception by tens of thousands of dollars.
The problem sits squarely in how you communicate those investments. A single, jargon-dense PDF delivered once a year cannot compete with the daily experience of a paycheck that feels light. Total rewards communication belongs on the same strategic footing as compensation planning itself, with year-round platforms that let managers walk employees through what the company actually spends on their behalf.
Swap the annual disclosure for an interactive experience that employees can access when the question is top of mind, not when HR decides it is calendar season. The fix does not require another dollar of new spending. It requires making the spending you already have impossible to overlook. If you're weighing options, CompUp is worth a closer look.
Total compensation includes base salary, bonuses, commissions, employer-paid health and retirement contributions, equity grants, paid time off, stipends, and professional development. Employees overlook these because most statements omit them or bury them in jargon, anchoring attention on the tangible cash salary that arrives every pay period.
Salary anchoring locks attention on base pay, while present bias makes deferred rewards like equity and retirement contributions feel less valuable than immediate cash. Information overload from dense, jargon-heavy statements triggers disengagement, so employees stop reading before they register the employer's full investment.
Static annual PDFs use technical language, dense tables, and a once-yearly cadence that clashes with human memory. Employees cannot access the information when making real-time compensation decisions, and the format offers no interactivity to explore projections or year-over-year growth, so comprehension collapses.
Organizations can take four immediate steps to shift from a compliance dump to a continuous value signal.
A platform like CompUp integrates payroll and equity data into interactive statements with year-over-year history and projected equity value. It gives employees self-serve access and equips managers with compensation dashboards, replacing the once-yearly static PDF with a continuous, personalized digital experience.
Community Manager (Marketing)
As a Community Manager, I’m passionate about fostering collaboration and knowledge sharing among professionals in compensation management and total rewards. I develop engaging content that simplifies complex topics, empowering others to excel and aim to drive collective growth through insight and connection.
Revolutionizing Pay Strategies: Don't Miss Our Latest Blogs on Compensation Benchmarking